The answer to that varies, depending on the region. Here’s a look at which countries gained—and lost—the most millionaires last year.
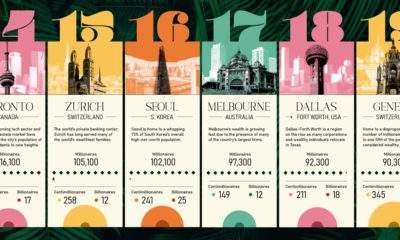
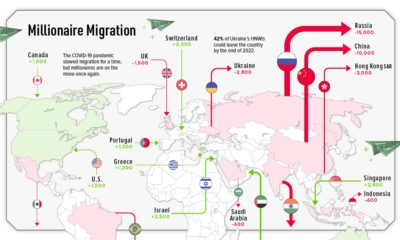
The World’s Millionaires: Top Gainers and Losers
There was an unusual amount of movement both in and out of the millionaires club in 2020. For instance, the U.S. gained almost 2.3 million new millionaires, while Brazil’s millionaires club lost around 81,000 members compared to its 2019 numbers: What are some possible reasons for this discrepancy? One potential factor is the stock market falls that were triggered by COVID-19. But another likely reason is currency devaluation, which could have happened regardless—during the first half of 2020, Mexico’s currency depreciated by 18%, while Brazil’s dropped by 27%.
Big Loss for Some, Huge Gain for Others
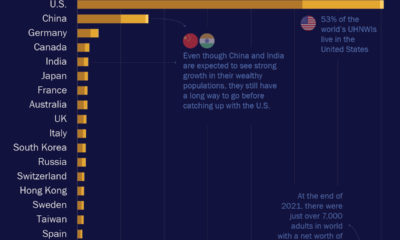
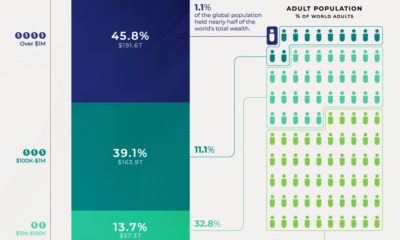
Clearly, the COVID-19 impact has differed greatly across regions. But geography isn’t the only factor at play—while certain sectors have proven to be pandemic proof, other industries have suffered greatly because of the virus. For instance, the tech sector thrived last year, and a few key tech billionaires grew their net worth significantly in 2020 as a result. On the flipside, hospitality took a beating, with many restaurants facing permanent closures. Source: Credit Suisse Global Wealth Report 2020 Details: This annual report is put together by the Credit Suisse Research Institute, and analyzes the household wealth of 5.2 billion people across the globe Notes: Millionaires are defined as adults with wealth above 1 million USD on Today’s connected cars come stocked with as many as 200 onboard sensors, tracking everything from engine temperature to seatbelt status. And all those sensors create reams of data, which will increase exponentially as the autonomous driving revolution gathers pace. With carmakers planning on uploading 50-70% of that data, this has serious implications for policymakers, manufacturers, and local network infrastructure. In this visualization from our sponsor Global X ETFs, we ask the question: will connected cars break the internet?
Data is a Plural Noun
Just how much data could it possibly be? There are lots of estimates out there, from as much as 450 TB per day for robotaxis, to as little as 0.383 TB per hour for a minimally connected car. This visualization adds up the outputs from sensors found in a typical connected car of the future, with at least some self-driving capabilities. The focus is on the kinds of sensors that an automated vehicle might use, because these are the data hogs. Sensors like the one that turns on your check-oil-light probably doesn’t produce that much data. But a 4K camera at 30 frames a second, on the other hand, produces 5.4 TB per hour. All together, you could have somewhere between 1.4 TB and 19 TB per hour. Given that U.S. drivers spend 17,600 minutes driving per year, a vehicle could produce between 380 and 5,100 TB every year. To put that upper range into perspective, the largest commercially available computer storage—the 100 TB SSD Exadrive from Nimbus—would be full in 5 hours. A standard Blu-ray disc (50 GB) would be full in under 2 seconds.
Lag is a Drag
The problem is twofold. In the first place, the internet is better at downloading than uploading. And this makes sense when you think about it. How often are you uploading a video, versus downloading or streaming one? Average global mobile download speeds were 30.78 MB/s in July 2022, against 8.55 MB/s for uploads. Fixed broadband is much higher of course, but no one is suggesting that you connect really, really long network cables to moving vehicles.
Ultimately, there isn’t enough bandwidth to go around. Consider the types of data traffic that a connected car could produce:
Vehicle-to-vehicle (V2V) Vehicle-to-grid (V2G) Vehicles-to-people (V2P) Vehicles-to-infrastructure (V2I) Vehicles-to-everything (V2E)
The network just won’t be able to handle it.
Moreover, lag needs to be relatively non-existent for roads to be safe. If a traffic camera detects that another car has run a red light and is about to t-bone you, that message needs to get to you right now, not in a few seconds.
Full to the Gunwales
The second problem is storage. Just where is all this data supposed to go? In 2021, total global data storage capacity was 8 zettabytes (ZB) and is set to double to 16 ZB by 2025.
One study predicted that connected cars could be producing up to 10 exabytes per month, a thousand-fold increase over current data volumes.
At that rate, 8 ZB will be full in 2.2 years, which seems like a long time until you consider that we still need a place to put the rest of our data too.
At the Bleeding Edge
Fortunately, not all of that data needs to be uploaded. As already noted, automakers are only interested in uploading some of that. Also, privacy legislation in some jurisdictions may not allow highly personal data, like a car’s exact location, to be shared with manufacturers.
Uploading could also move to off-peak hours to even out demand on network infrastructure. Plug in your EV at the end of the day to charge, and upload data in the evening, when network traffic is down. This would be good for maintenance logs, but less useful for the kind of real-time data discussed above.
For that, Edge Computing could hold the answer. The Automotive Edge Computing Consortium has a plan for a next generation network based on distributed computing on localized networks. Storage and computing resources stay closer to the data source—the connected car—to improve response times and reduce bandwidth loads.
Invest in the Future of Road Transport
By 2030, 95% of new vehicles sold will be connected vehicles, up from 50% today, and companies are racing to meet the challenge, creating investing opportunities.
Learn more about the Global X Autonomous & Electric Vehicles ETF (DRIV). It provides exposure to companies involved in the development of autonomous vehicles, EVs, and EV components and materials.
And be sure to read about how experiential technologies like Edge Computing are driving change in road transport in Charting Disruption. This joint report by Global X ETFs and the Wall Street Journal is also available as a downloadable PDF.