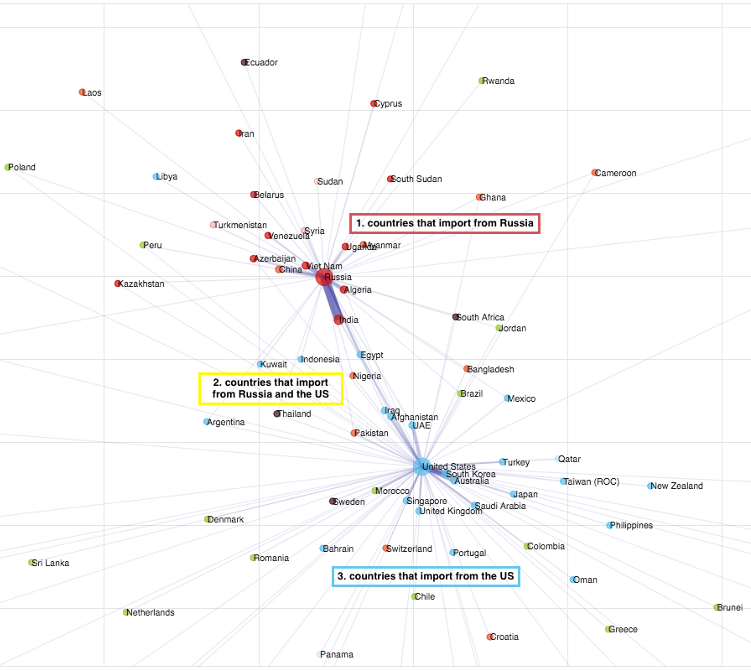
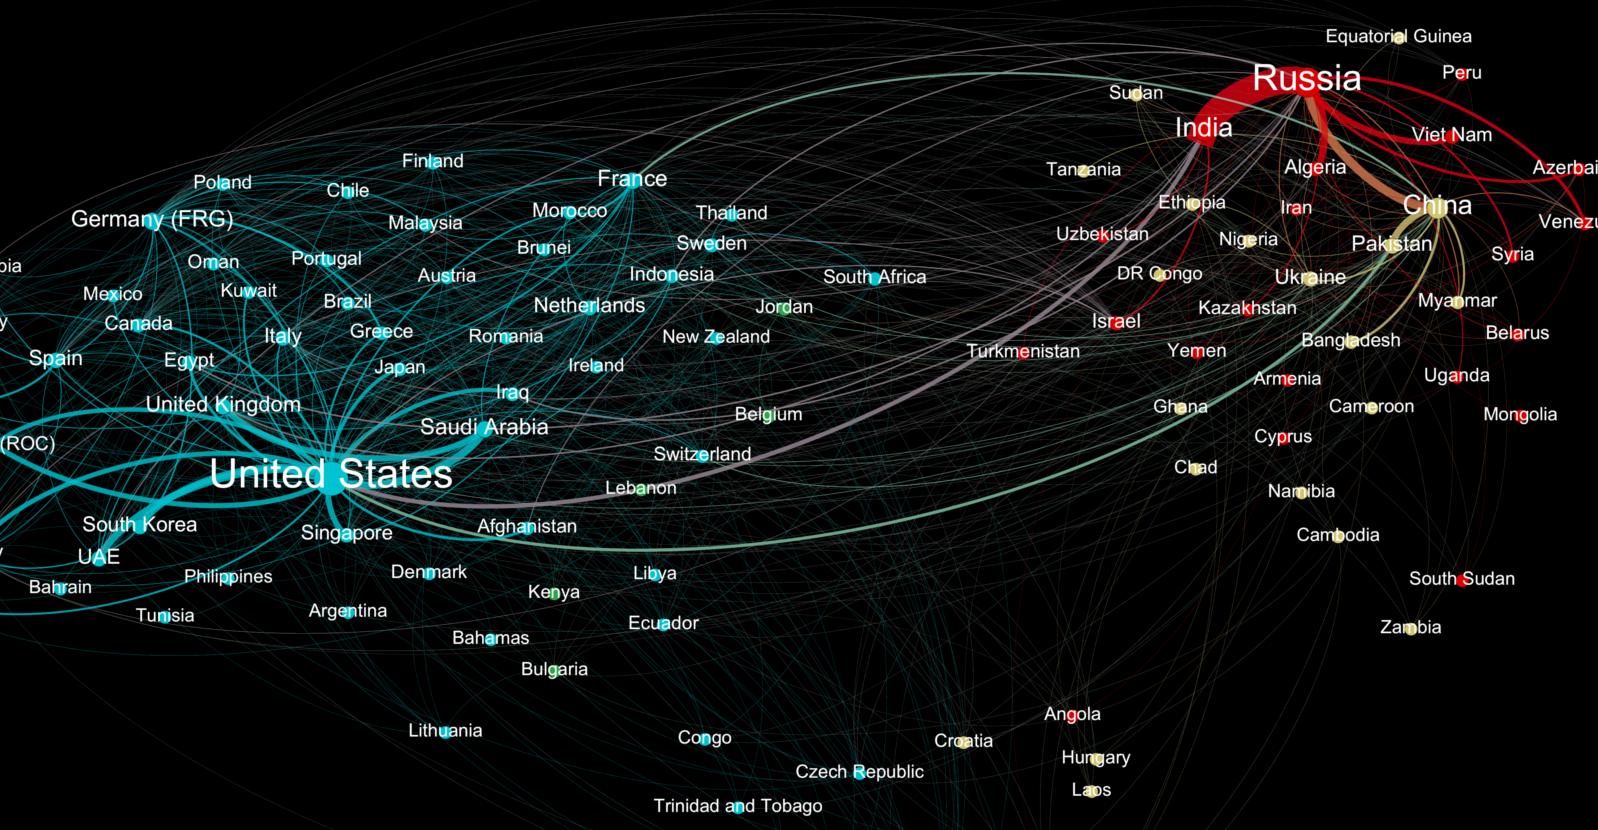
The above visualization sums up the global weapons trade during the Obama era, minus data from 2016. It was created by data scientist Hai Nguyen Mau, and each relationship plots the value of the weapons trade between two countries based on data from SIPRI. It’s important to note that while this data includes major weaponry transfers such as tanks, jets, missiles, and ships, it excludes guns and ammunition or military aid. Lastly, the thickness of each line represents the total value of each trade relationship, while the proximity of two linked countries shows how close each relationship is. (i.e. if a country only imports from Russia, they will be much closer to Russia than the U.S.)
A Longtail Distribution
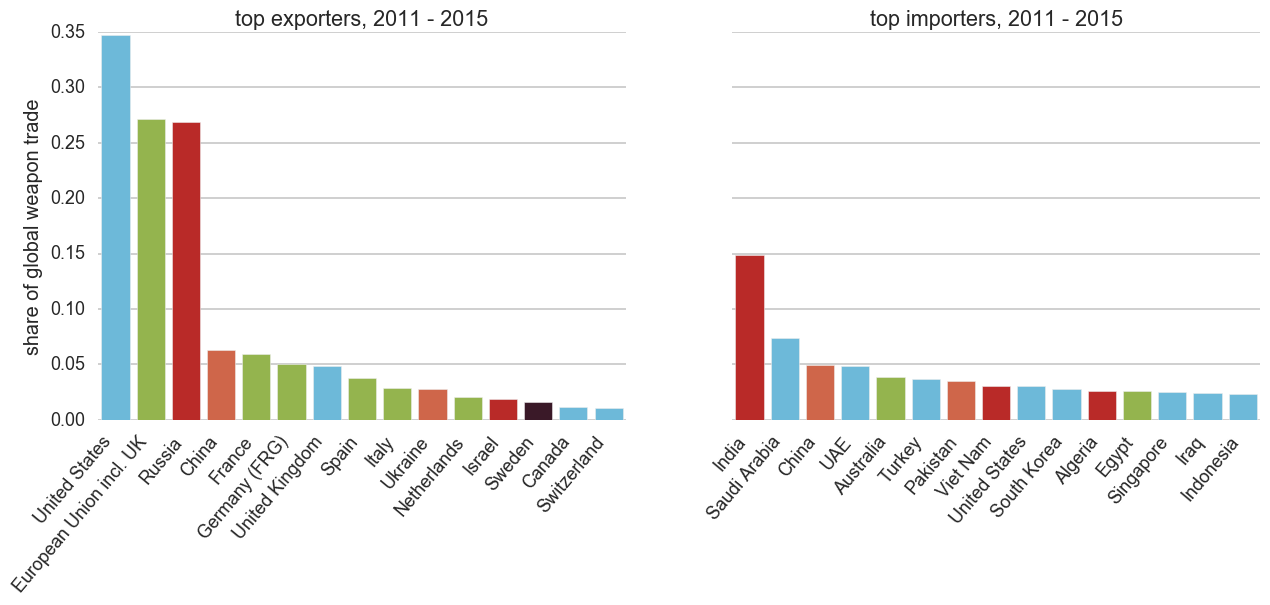
The global weapons trade is dominated by a few major exporters, such as United States, EU, and Russia:
Together, the United States, European Union, and Russia combine for over 80% of weapons exports, while the rest of the world fills out the “longtail” of the exporter distribution. From the perspective of imports, the field is much more equal because almost every country aims to spend at least some money on defense. India is the largest importer of weapons in the world with a 14% share of the market.
Two Distinct Blocs
The picture behind the global weapons trade gets much more interesting as it is broken up into relationships. It’s easy to see that there are two distinct blocs of trade: The West: United States, United Kingdom, Canada, most of the EU, and other countries The East: Russia, China, India, Nigeria, and other countries As an example, Singapore imports 71% of its weapons from the United States along with significant amounts from Germany (10%) and Sweden (6%). As such, it is very close to the United States in these visualizations. Meanwhile, India imports 70% of its arms from Russia, with the U.S. (12%) and Israel (7%) as other major partners. Here’s another look from Hai Nguyen Mau that just focuses on U.S. and Russian relationships: An oversimplication, to be sure – but these visualizations hint at the broader tensions that have recently surfaced to the forefront of geopolitical discourse. on The good news is that the Federal Reserve, U.S. Treasury, and Federal Deposit Insurance Corporation are taking action to restore confidence and take the appropriate measures to help provide stability in the market. With this in mind, the above infographic from New York Life Investments looks at the factors that impact bonds, how different types of bonds have historically performed across market environments, and the current bond market volatility in a broader context.
Bond Market Returns
Bonds had a historic year in 2022, posting one of the worst returns ever recorded. As interest rates rose at the fastest pace in 40 years, it pushed bond prices lower due to their inverse relationship. In a rare year, bonds dropped 13%.
Source: FactSet, 01/02/2023.
Bond prices are only one part of a bond’s total return—the other looks at the income a bond provides. As interest rates have increased in the last year, it has driven higher bond yields in 2023.
Source: YCharts, 3/20/2023.
With this recent performance in mind, let’s look at some other key factors that impact the bond market.
Factors Impacting Bond Markets
Interest rates play a central role in bond market dynamics. This is because they affect a bond’s price. When rates are rising, existing bonds with lower rates are less valuable and prices decline. When rates are dropping, existing bonds with higher rates are more valuable and their prices rise. In March, the Federal Reserve raised rates 25 basis points to fall within the 4.75%-5.00% range, a level not seen since September 2007. Here are projections for where the federal funds rate is headed in 2023:
Federal Reserve Projection*: 5.1% Economist Projections**: 5.3%
*Based on median estimates in the March summary of quarterly economic projections.**Projections based on March 10-15 Bloomberg economist survey. Together, interest rates and the macroenvironment can have a positive or negative effect on bonds.
Positive
Here are three variables that may affect bond prices in a positive direction:
Lower Inflation: Reduces likelihood of interest rate hikes. Lower Interest Rates: When rates are falling, bond prices are typically higher. Recession: Can prompt a cut in interest rates, boosting bond prices.
Negative
On the other hand, here are variables that may negatively impact bond prices:
Higher Inflation: Can increase the likelihood of the Federal Reserve to raise interest rates. Rising Interest Rates: Interest rate hikes lead bond prices to fall. Weaker Fundamentals: When a bond’s credit risk gets worse, its price can drop. Credit risk indicates the chance of a default, the risk of a bond issuer not making interest payments within a given time period.
Bonds have been impacted by these negative factors since inflation started rising in March 2021.
Fixed Income Opportunities
Below, we show the types of bonds that have had the best performance during rising rates and recessions.
Source: Derek Horstmeyer, George Mason University 12/3/2022. As we can see, U.S. ultrashort bonds performed the best during rising rates. Mortgage bonds outperformed during recessions, averaging 11.4% returns, but with higher volatility. U.S. long-term bonds had 7.7% average returns, the best across all market conditions. In fact, they were also a close second during recessions. When rates are rising, ultrashort bonds allow investors to capture higher rates when they mature, often with lower historical volatility.
A Closer Look at Bond Market Volatility
While bond market volatility has jumped this year, current dislocations may provide investment opportunities. Bond dislocations allow investors to buy at lower prices, factoring in that the fundamental quality of the bond remains strong. With this in mind, here are two areas of the bond market that may provide opportunities for investors:
Investment-Grade Corporate Bonds: Higher credit quality makes them potentially less vulnerable to increasing interest rates. Intermediate Bonds (2-10 Years): Allow investors to lock in higher rates.
Both types of bonds focus on quality and capturing higher yields when faced with challenging market conditions.
Finding the Upside
Much of the volatility seen in the banking sector was due to banks buying bonds during the pandemic—or even earlier—at a time when interest rates were historically low. Since then, rates have climbed considerably. Should rates moderate or stop increasing, this may present better market conditions for bonds. In this way, today’s steep discount in bond markets may present an attractive opportunity for price appreciation. At the same time, investors can potentially lock in strong yields as inflation may subside in the coming years ahead. Learn more about bond investing strategies with New York Life Investments.