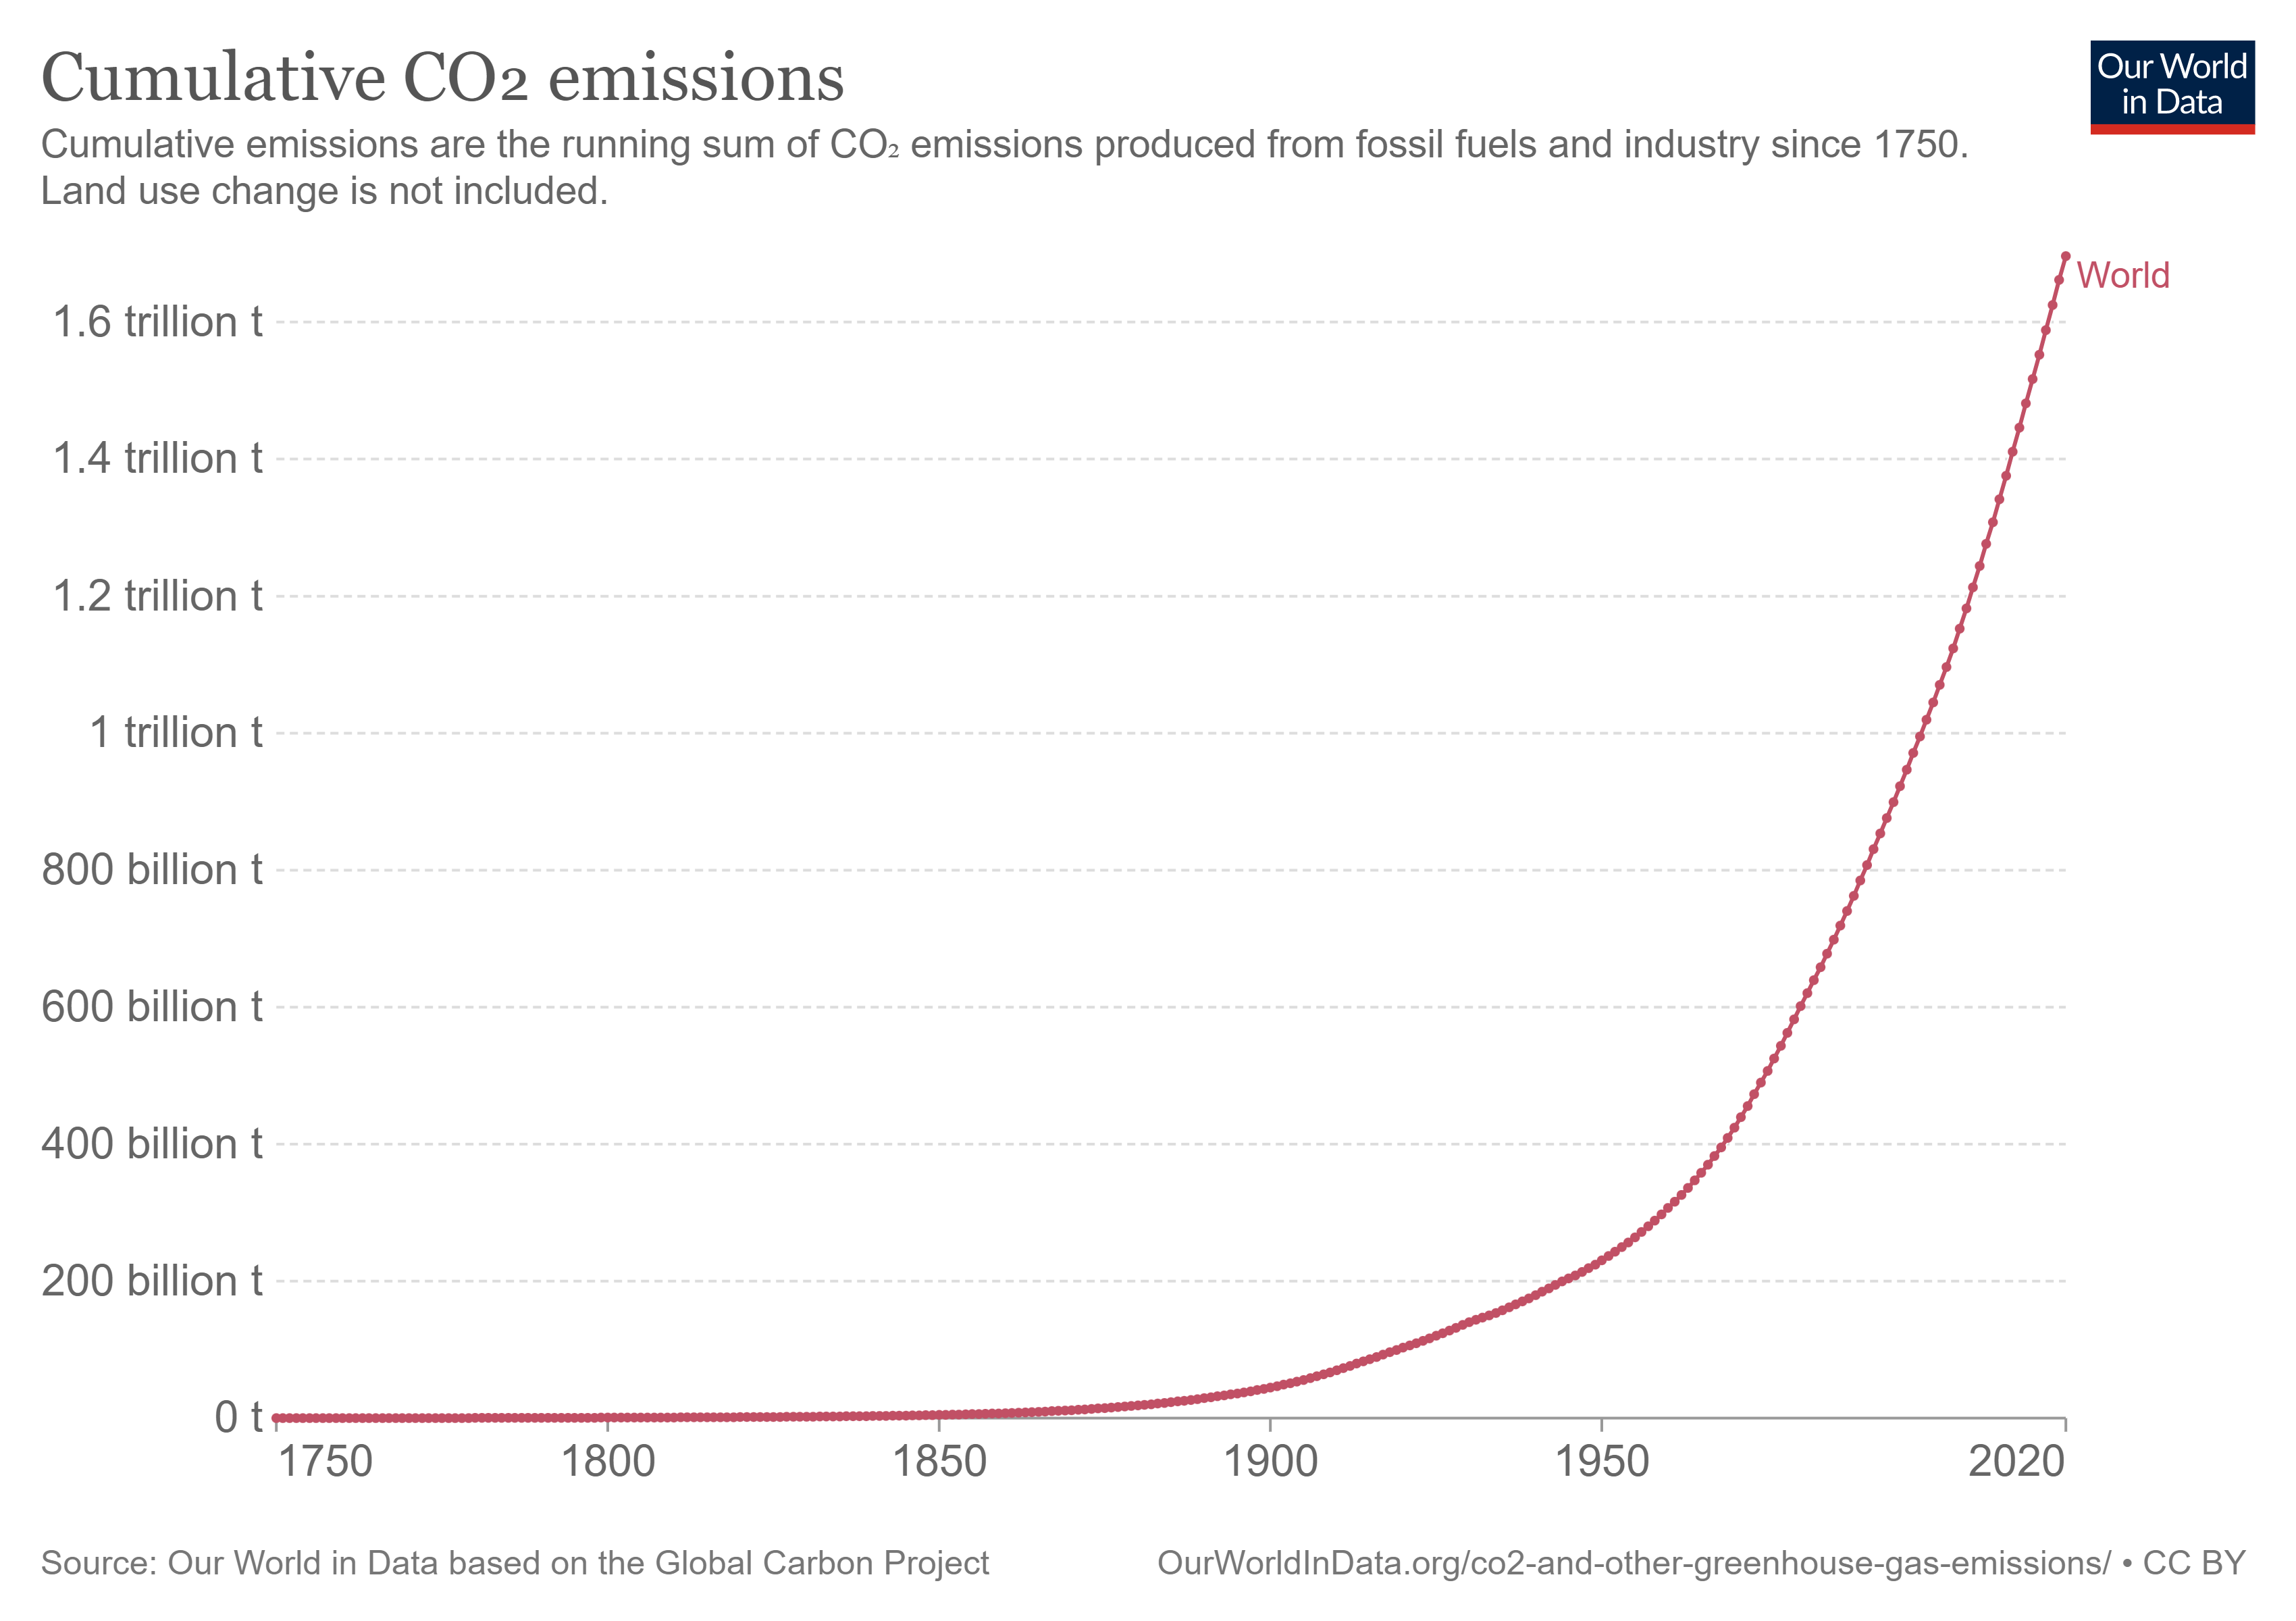
Leaders from all over the world are currently gathering at the Conference of the Parties of the UNFCCC (COP 27) in Egypt to discuss climate action, and to negotiate the commitments being made by countries to the global climate agenda. This visualization based on data from the Global Carbon Project shows the changes in global fossil fuel carbon dioxide (CO₂) emissions from 1900 to 2020, putting the challenge of fighting climate change into perspective.
Cumulative CO₂ Emissions vs. Rate of Change
Global climate change is primarily caused by carbon dioxide emissions. Fossil fuels like coal, oil, and gas release large amounts of CO₂ when burned or used in industrial processes. Before the Industrial Revolution (1760-1840), emissions were very low. However, with the increased use of fossil fuels to power machines, emissions rose to 6 billion tonnes of CO₂ per year globally by 1950. The amount had almost quadrupled by 1990, reaching a rate of over 22 billion tonnes per year. Currently, the world emits over 34 billion tonnes of CO₂ each year. Since 1751, the world has emitted over 1.5 trillion tonnes of CO₂ cumulatively.
Prior to the COVID-19 pandemic, average global growth in fossil CO₂ emissions had slowed to 0.9% annually during the 2010s, reaching 36.7 gigatons of CO₂ added to the atmosphere in 2019. However, in 2020, global lockdowns led to the biggest decrease in CO₂ emissions ever seen in absolute terms. Global fossil CO₂ emissions decreased by 5.2% to 34.8 gigatons, mainly due to halts in aviation, surface transport, power generation, and manufacturing during the pandemic. Since then, emissions have approached pre-pandemic levels, reaching 36.2 gigatons added to the atmosphere in 2021.
Biggest Emitters, by Country
Asia, led by China, is the largest emitter, with the continent accounting for more than half of global emissions. CO₂ emissions from developing economies already account for more than two-thirds of global emissions, while emissions from advanced economies are in a structural decline.
Coal Power Generation Set for Record Increase
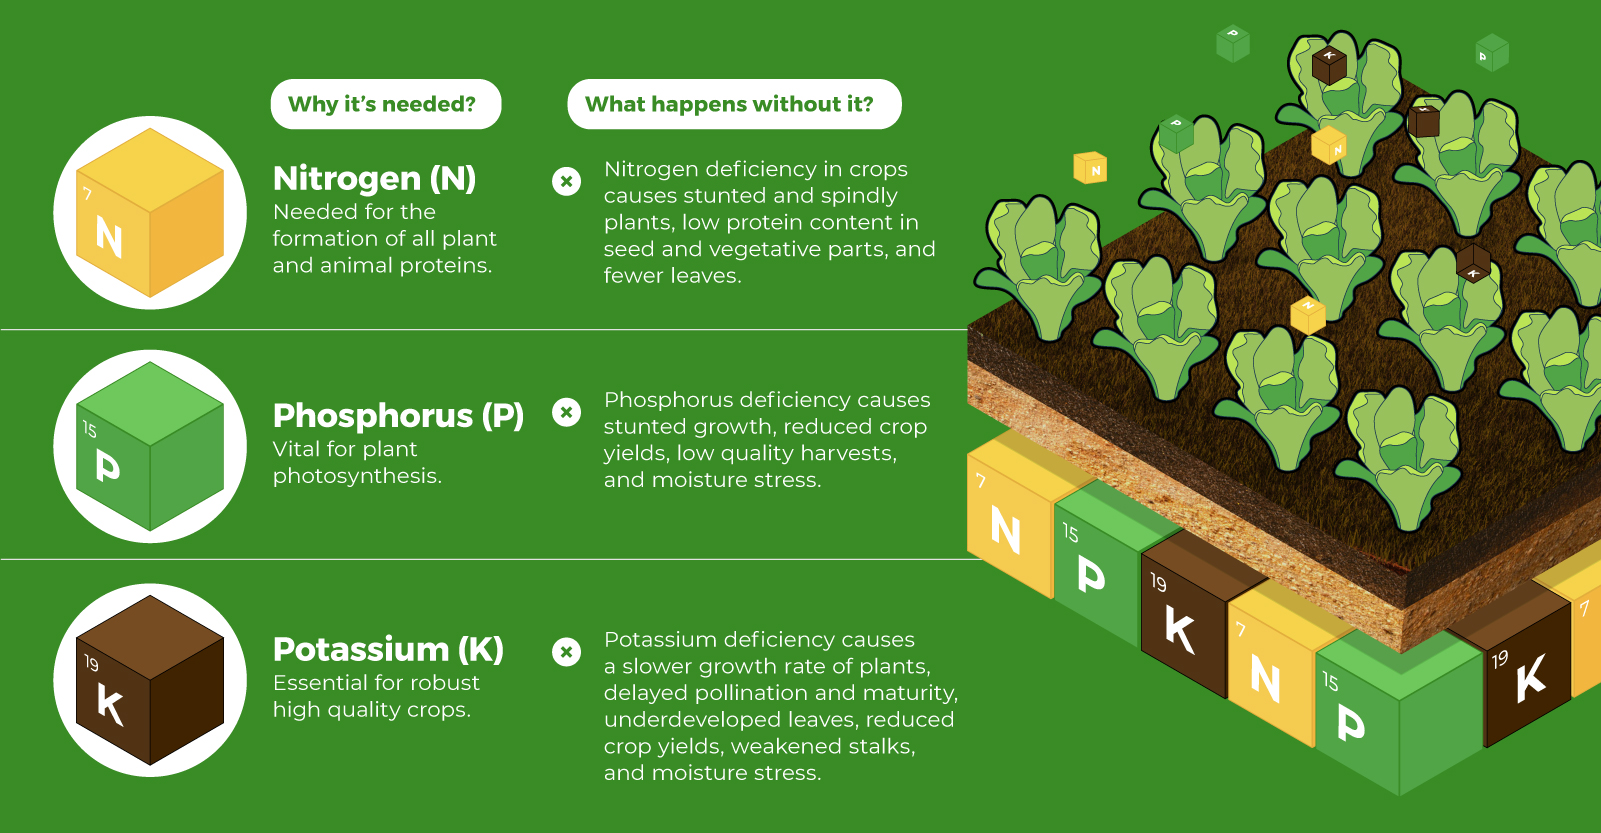
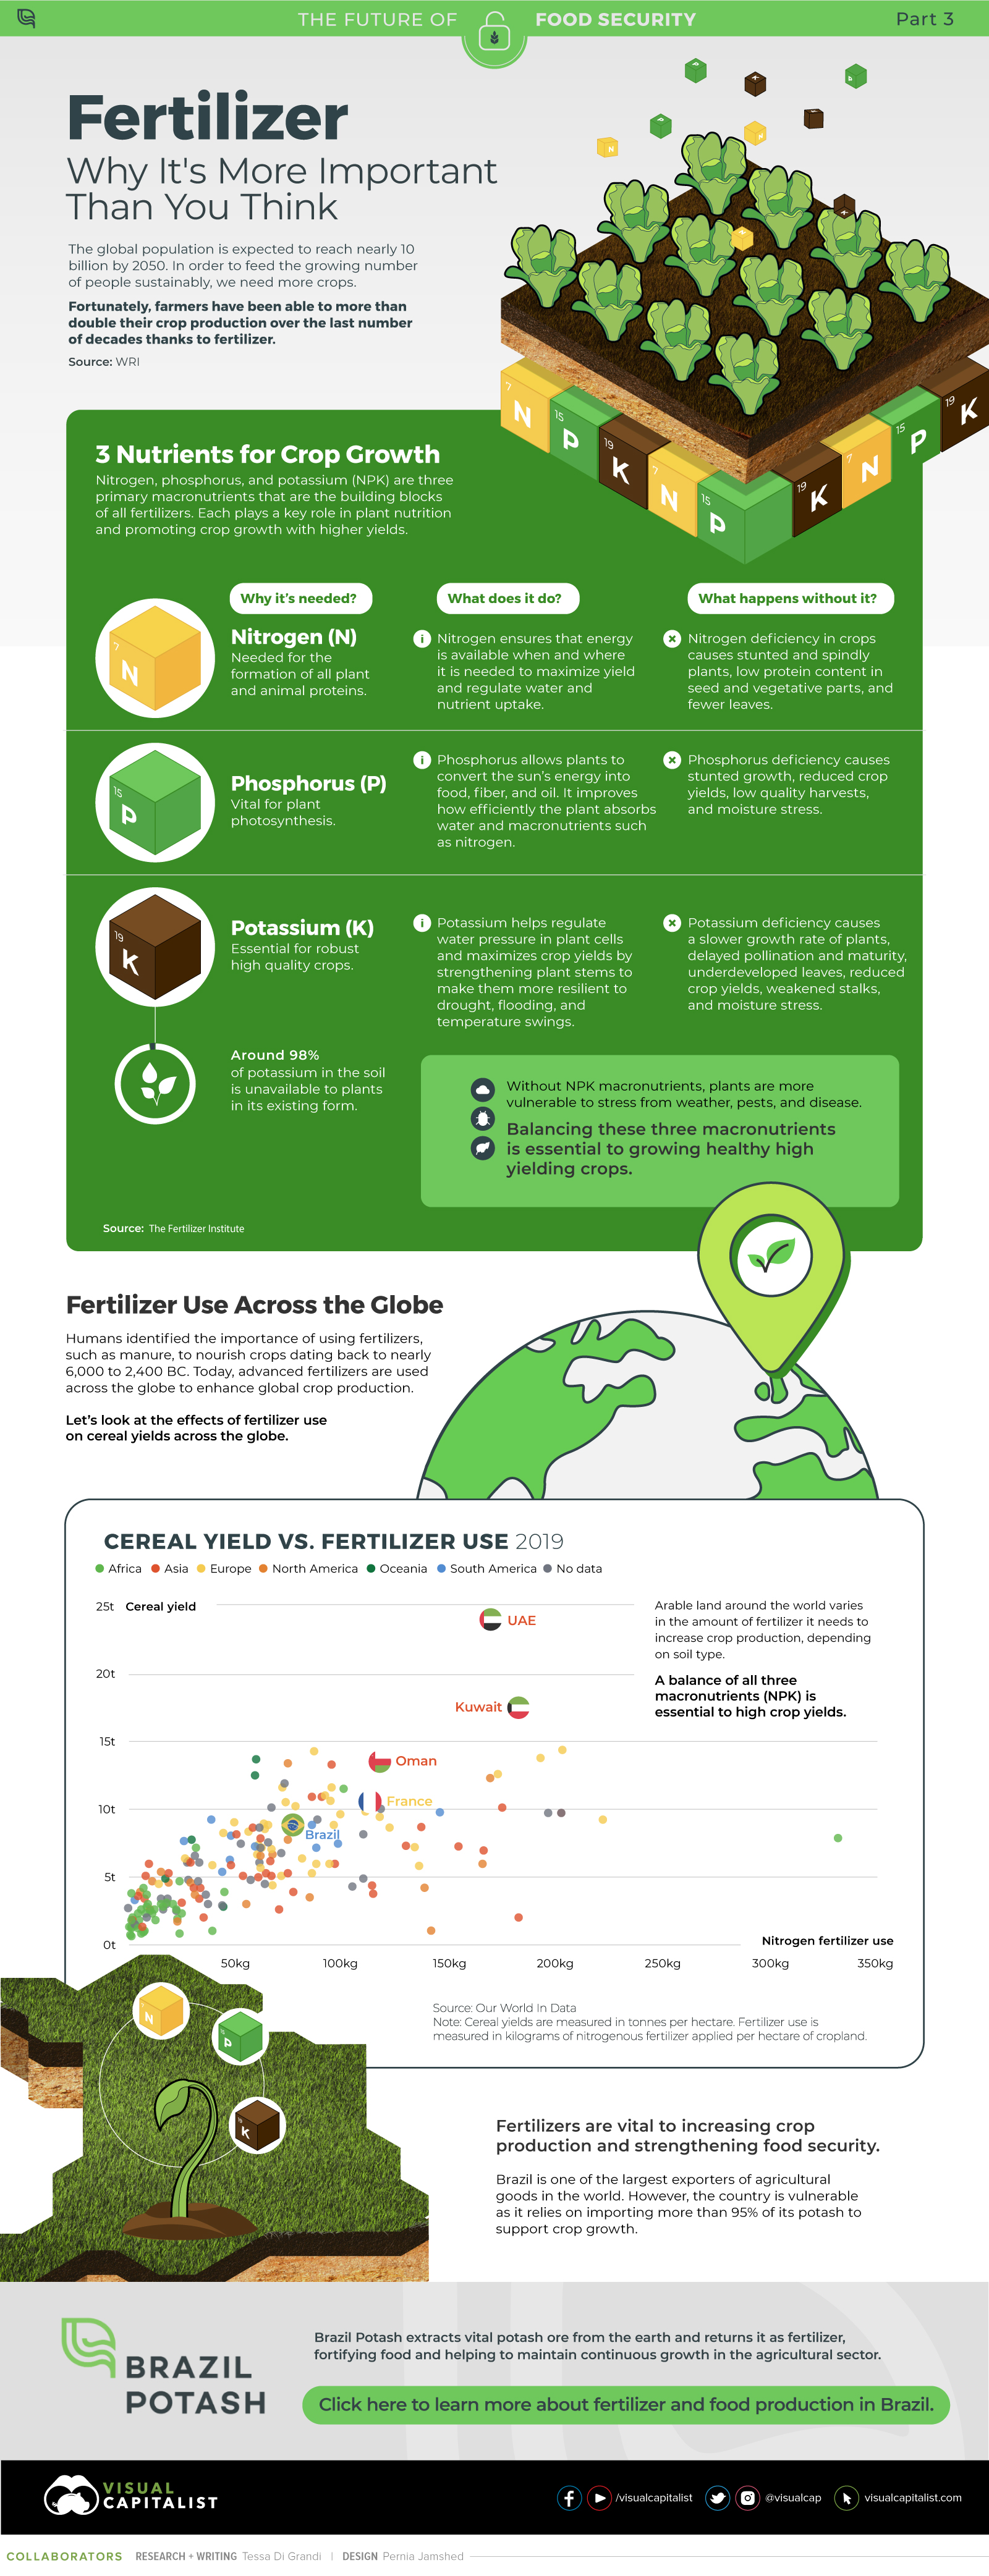
To avoid the worst impacts of climate change, more than 130 countries have now set or are considering a target of reducing emissions to net zero by 2050. Much of the slowdown in emissions growth in the 2010s was attributable to the substitution of coal—the fuel that contributes most to planet-warming emissions—with gas and renewables. In addition, during the previous COP26 held in Glasgow, 40 nations agreed to phase coal out of their energy mixes. Despite that, in 2021, coal-fired electricity generation reached all-time highs globally and is set for a new record in 2022 as consumption surged in Europe to replace shortfalls in hydro, nuclear, and Russian natural gas. As leaders meet in Egypt for the world’s largest gathering on climate action, it will be up to them to come up with a plan for making their environmental aspirations a reality. on Over recent decades, farmers have been able to more than double their production of crops thanks to fertilizers and the vital nutrients they contain. When crops are harvested, the essential nutrients are taken away with them to the dining table, resulting in the depletion of these nutrients in the soil. To replenish these nutrients, fertilizers are needed, and the cycle continues. The above infographic by Brazil Potash shows the role that each macronutrient plays in growing healthy, high-yielding crops.
Food for Growth
Nitrogen, phosphorus, and potassium (NPK) are three primary macronutrients that are the building blocks of the global fertilizer industry. Each plays a key role in plant nutrition and promoting crop growth with higher yields. Let’s take a look at how each macronutrient affects plant growth. If crops lack NPK macronutrients, they become vulnerable to various stresses caused by weather conditions, pests, and diseases. Therefore, it is crucial to maintain a balance of all three macronutrients for the production of healthy, high-yielding crops.
The Importance of Fertilizers
Humans identified the importance of using fertilizers, such as manure, to nourish crops dating back to nearly 6,000 to 2,400 BC. As agriculture became more intensive and large-scale, farmers began to experiment with different types of fertilizers. Today advanced chemical fertilizers are used across the globe to enhance global crop production. There are a myriad of factors that affect soil type, and so the farmable land must have a healthy balance of all three macronutrients to support high-yielding, healthy crops. Consequently, arable land around the world varies in the amount and type of fertilizer it needs. Fertilizers play an integral role in strengthening food security, and a supply of locally available fertilizer is needed in supporting global food systems in an ever-growing world. Brazil is one of the largest exporters of agricultural goods in the world. However, the country is vulnerable as it relies on importing more than 95% of its potash to support crop growth. Brazil Potash is developing a new potash project in Brazil to ensure a stable domestic source of this nutrient-rich fertilizer critical for global food security. Click here to learn more about fertilizer and food production in Brazil.