— Larry Fink, CEO of BlackRock, the world’s largest asset manager Which of the world’s largest companies are stepping up to the plate on these issues?
The Global 100 Index
Today’s visualization pulls data from Corporate Knight’s 2019 Global 100 report, which ranks the most sustainable corporations in the world. Any public company with revenue of at least $1B USD is screened for various factors such as sufficient sustainability reporting. The resulting corporations are scored on an industry-specific mix of performance metrics in the following areas:
Resource Management Employee Management Financial Management Clean Revenue Supplier Performance
The final ranking represents the top companies from each sector, with the number from each sector based on the relative size of its market capitalization.
Sustainable Corporations by Country
Here’s all the countries that had companies on the list: The U.S. tops the list with 22 companies – far more than any other country. European countries also dominate the list and have 51 companies on the G100 overall. Notably, the populous countries of India and China have no representation on the list.
The Top 10 Companies
So, which individual companies made the list? Here’s a snapshot of the star players: Chr. Hansen Holding A/S leapt from #66 in 2018 to the top spot this year. According to CEO Mauricio Graber, the company develops “cultures, enzymes, probiotics and natural colors for a rich variety of foods, confectionery, beverages, dietary supplements and even animal feed.” A staggering 82% of Chr. Hansen’s revenue contributes to the United Nations’ Sustainability Goals. The company is using good bacteria to reduce antibiotic use, crop pesticides, and food waste. Over the last three years, the company has reduced yogurt waste by 400,000 tonnes.
What’s in it for Companies?
While societal pressure is certainly one motivating factor, Harvard Business Review notes that corporate sustainability has many benefits:
Drives competitive advantage through stakeholder engagement Improves risk management Fosters innovation Improves financial performance Builds customer loyalty Attracts and engages employees
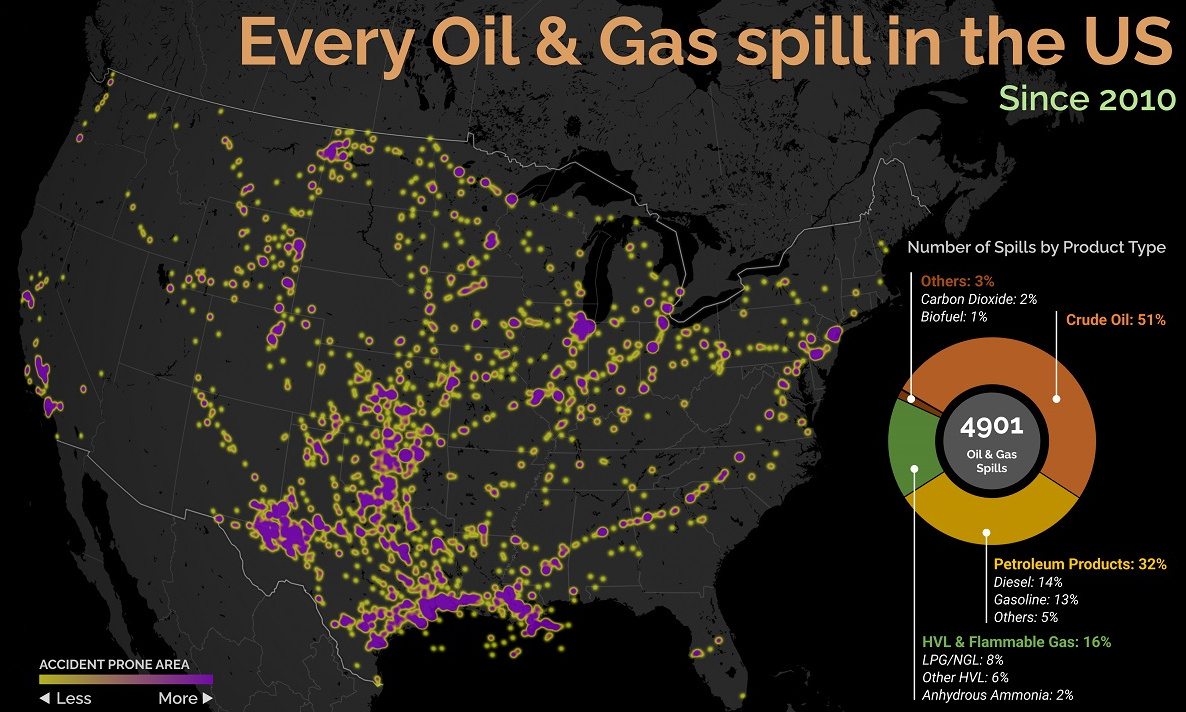
It’s clear that sustainability is a strong differentiator in the business community. The world’s largest – and smartest – companies are leading the charge towards a greener, more equitable future. on Aside from the obvious climate impact they bring, one other downside in particular is spills, which can lead to ecological and economic damage. These can happen due to pipeline leaks, train derailments, or other industrial disasters. This graphic from Preyash Shah provides a visual overview of every oil and gas spill in the contiguous U.S. since 2010. Data is tracked by the U.S. government’s Pipeline and Hazardous Materials Safety Administration (PHMSA).
U.S. Oil and Gas Spills (2010‒2022)
The majority of spills that have occurred come mostly from crude oil, followed by petroleum products and gas. Note that this data covers the quantity of spills and not damages or volume.
Crude oil, which makes up just over half of documented spills, is also one of the most costly. Contaminations can persist for years after a spill, and its impact on local mammals and waterfowl is particularly harsh. This has been the case with the Deepwater Horizon spill (also known as the “BP oil spill”), which experts say is still causing harm in the Gulf of Mexico. Other products with lots of spills include petroleum products such as diesel or gasoline, as well as liquefied natural gas or other volatile liquids. Interestingly, liquefied carbon dioxide can also be transported in pipelines, commonly used for carbon capture storage, but requires high pressure to maintain its state. When looking at the location of spills, it’s clear that the South Central states have experienced the highest number of disasters. In contrast, the West Coast has had substantially less activity. However, this makes much more sense when looking at the dominant oil producing states, where Texas and surrounding neighbors reign supreme. Of the 4,901 spills during this period, Texas accounts for 1,936 or roughly 40% of all oil and gas spills. This is followed by Oklahoma, which has had 407 spills and is one of the largest net exporters of oil and gas in the country.
What Causes Spills?
Oil and gas spills actually have a surprisingly long history, with one of the earliest dating back to 1889, when a spill was reported on the coast between Los Angeles and San Diego. Causes have consisted primarily of weather, natural disasters, equipment and technological malfunction, as well as human error. However, they only became a widespread problem around the halfway mark of the 20th century, when petroleum extraction and production really began to take off. This era also saw the emergence of supertankers, which can transport half a million tons of oil but therefore make the risk of spills even costlier. In fact, the biggest spill off U.S. waters after the Deepwater Horizon disaster is the 1989 Exxon Valdez spill in Alaska, when a tanker crashed into a reef and 11 million gallons of oil spilled into the Pacific Ocean.