Almost half of all university-educated Americans rely on loans to pay for their higher education, with very few graduating debt-free. Total U.S. student debt has more than doubled in the last decade—reaching a record high of $1.5 trillion today. Today’s data visualization from HowMuch.net breaks down the average student debt per capita, to uncover which states shoulder the highest burden in this growing crisis.
Students are Paying Through the Nose
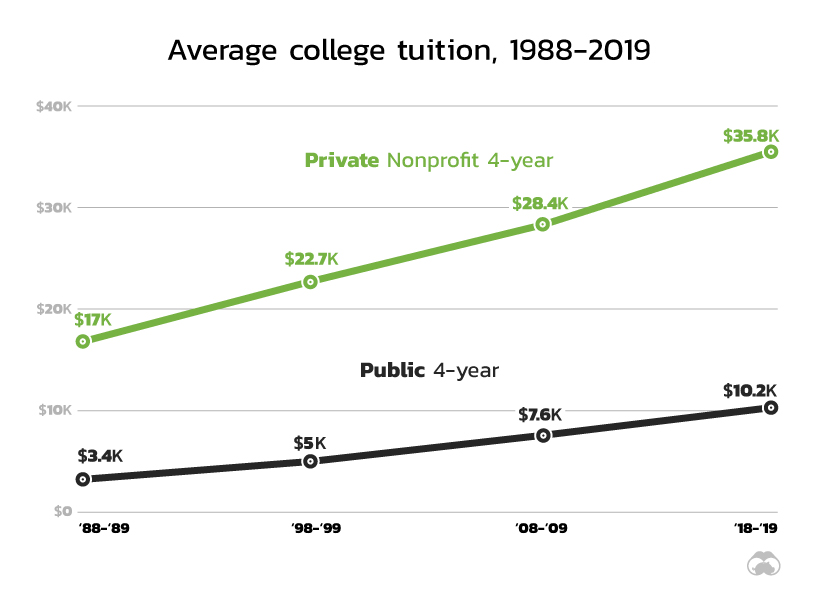
Before diving into the graphic, let’s take a quick look at why student debt is racking up. The ballooning costs to attend college today compared to thirty years ago is one driving factor. Source: The College Board 2018 report. What’s more, these figures don’t include the expenses for accommodation and other supplies, which can add another $15,000-$17,000 per year.
The United States of Student Debt
In the state map above, it’s immediately obvious that Washington D.C. tops the list. While the nation’s capital is the most educated metropolitan area in the country, it also suffers from $13,320 in student debt per capita. At approximately 147% above than the national average of $5,390, Washington D.C.’s debt burden per capita is almost double that of the state in second place. Georgia comes in with $7,250 debt per capita, 34.5% above the national average. Rounding out the five states with the most student debt per capita are Maryland, Minnesota, and Ohio, in that order. On the flip side, Wyoming has the least debt per capita ($3,610), which is 33.0% lower than the national average. Hawaii follows right behind at $3,780, and 29.9% below the national average. Interestingly, a growing population on the West Coast helps to lower the debt burden for states like California, even despite the strong presence of prestigious schools. Home to Stanford, USC, UCLA, CalTech, and more, the Golden State surprisingly only has $4,530 in debt per capita.
The Last Straw?
Today’s Americans are more educated than ever before, but the sticker shock is causing some whiplash. This overall trend of spiraling student debt has significant implications on a person’s life trajectory. With many graduates unable to repay their loans on time, more of them are delaying major life milestones, such as starting a family or becoming a homeowner. In efforts to curb this crisis, many 2020 presidential hopefuls have already started proposing plans to cancel or forgive student debt—with close attention on mid- to low-income households that would benefit the most from reduced loans. on In this infographic, we’ve visualized data from the Fed’s most recent consumer debt update.
Aggressive Borrowing
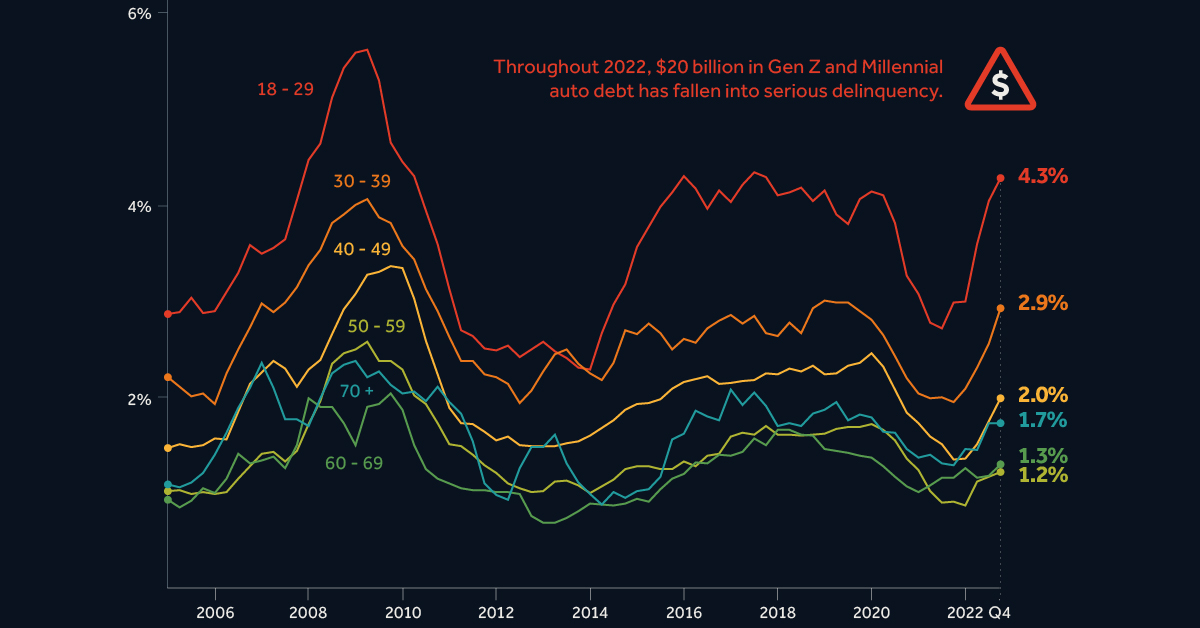
The first chart in this graphic shows the growth in outstanding car loans between Q2 2020 (start of the pandemic) to Q4 2022 (latest available). We can see that Americans under the age of 40 have grown their vehicle-related debt the most. It’s natural for Gen Z (ages 11-26) to have higher growth figures because many of them are buying their first car, but 31% is quite high relatively speaking. Part of this can be attributed to today’s inflationary environment, which has pushed used car prices to new highs. Supply chain issues have also resulted in over 30% of new cars being sold above MSRP. Because of these rising prices, the Fed reports that the average auto loan is now $24,000, up 41% from 2019’s value of $17,000.
Spiking Delinquencies
Interest rates on auto loans are typically fixed, meaning many young Americans were able to take advantage of the low rates seen during the pandemic. Despite this, one in five Gen Zs say that their car payments account for over 20% of their after-tax income. Shown in the second chart of this infographic, the amount of auto debt transitioning into serious delinquency is much higher for Gen Z and Millennials. Throughout 2022, these generations saw $20 billion in auto debt fall 90+ days behind. The outlook for these struggling borrowers is bleak. First there’s inflation, which has pushed up the prices of most consumer goods. This eats into their ability to make car payments. Second is rising interest rates, which make credit card debt—another pain point for young borrowers—even more costly. Finally, there’s student loans, which are expected to resume in summer 2023. Payments on student debt have been suspended since the beginning of the COVID-19 pandemic.