And North America is a major oil hub. The U.S. and Canada alone are home to more than 90,000 miles of crude oil and petroleum product pipelines, along with more than 140 refineries that can process around 20 million barrels of oil every day. This interactive graphic uses data from Rextag to map out crude oil pipelines and refineries across the U.S. and Canada, showcasing individual pipeline diameter and daily refinery throughput.
The Longest Crude Oil Pipeline Networks in North America
Since 2010, U.S. crude oil production has more than doubled from 5.4 million barrels a day to more than 11.5 million. Meanwhile, the pipeline networks needed to transport this newly produced oil have only expanded by roughly 56%. Today, the largest pipeline network across the U.S. and Canada (with a diameter of at least 10 inches) is the 14,919 mile network managed by Plains, which spans from the northwestern tip of Alberta all the way down to the southern coasts of Texas and Louisiana. Source: Rextag Enbridge owns the next largest crude oil pipeline network, with 12,974 miles of crude oil pipelines that are at least 10 inches in diameter. The Canadian company, one of the world’s largest oil companies, transports about 30% of the crude oil produced in North America. Following the networks of Plains and Enbridge, there’s a steep drop off in the length of pipeline networks, with Sunoco’s crude oil pipeline network spanning about half the length of Enbridge’s at 6,409 miles.
The Largest Crude Oil Refineries in North America
These various sprawling pipeline networks initially carry crude oil to refineries, where it is processed into gasoline, diesel fuel, and other petroleum products. The refineries with the largest throughput in North America are all located in the Gulf Coast (PADD 3), with the five refineries that process more than 500,000 barrels per day all located in the states of Louisiana and Texas. Source: Rextag While Texas and Louisiana have six refineries that process more than 400,000 barrels per day, there are only two other facilities outside of these states with the same kind of throughput, located in Whiting, Indiana (435,000 barrels per day) and Fort McMurray, Alberta (465,000 barrels per day). Fort McMurray’s facility is an upgrader, which differs from refineries as it upgrades heavy oils like bitumen into lighter synthetic crude oil which flows through pipelines more easily. Many oil refineries aren’t able to directly convert bitumen, which is extracted from oil sands like those found in Alberta, making upgraders a necessary part in the production and processing of crude oil from oil sands.
The Uncertain Future of New Pipelines in North America
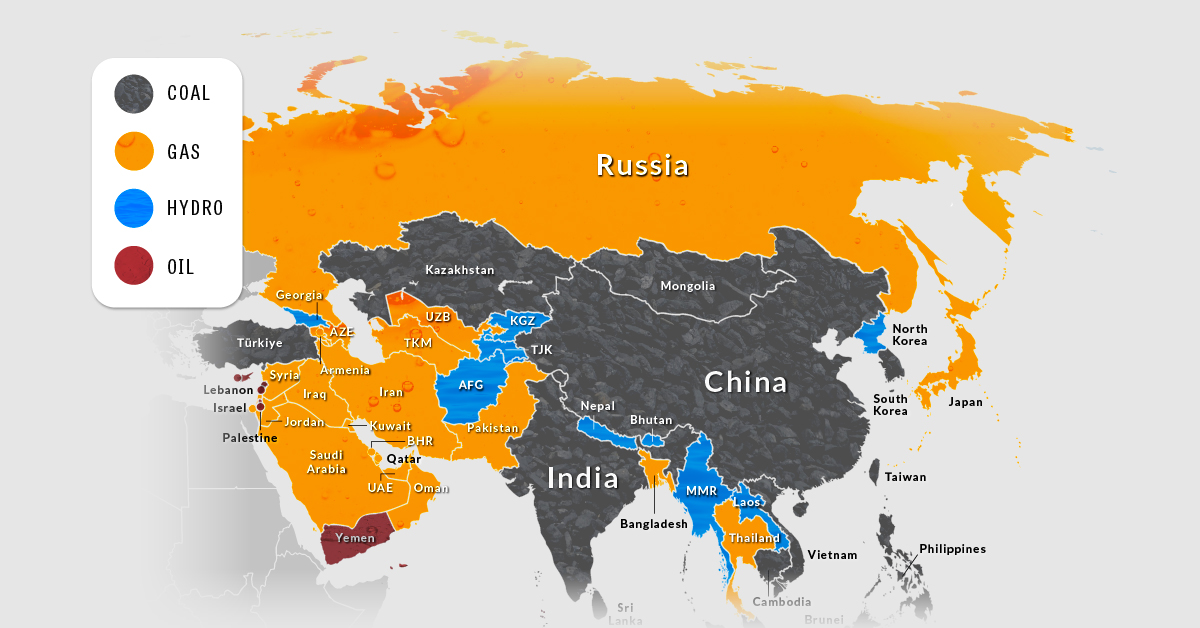
The development of new pipelines remains a contentious issue in Canada and the U.S., with the cancellation of the Keystone XL pipeline emblematic of growing anti-pipeline sentiment. In 2021, only 14 petroleum liquids pipeline projects were completed in the U.S., which was the lowest amount of new pipelines and expansions since 2013. But domestic energy production is once again in the spotlight due to the U.S. ban on Russian oil imports and Russia’s impending export ban on raw materials. North American consumers are now facing surging gasoline and energy prices as foreign oil is proving to be far less reliable in times of geopolitical turmoil. It’s important to note that pipelines are not a perfect solution, as leaks and spills in just the last decade have resulted in billions of dollars of damages. From 2010 to 2020, the Pipeline and Hazardous Materials Safety Administration recorded 983 incidents that resulted in 149,000 spilled and unrecovered barrels of oil, five fatalities, 27 injuries, and more than $2.5B in damages. But over the past five years, liquid pipeline incidents have fallen by 21% while pipeline mileage and barrels delivered have increased by more than 27%. Along with these infrastructure improvements, pipeline developers and operators emphasize the lack of better alternatives, as freight and seaborne transportation are both far less efficient and result in more carbon emissions. Currently, pipelines remain key components of energy consumption across the U.S. and Canada, and as global energy markets face supply squeezes, international sanctions, and geopolitical turbulence, the focus on them has grown. on The International Energy Agency (IEA) predicts that Asia will account for half of the world’s electricity consumption by 2025, with one-third of global electricity being consumed in China. To explore how this growing electricity demand is currently being met, the above graphic maps out Asia’s main sources of electricity by country, using data from the BP Statistical Review of World Energy and the IEA.
A Coal-Heavy Electricity Mix
Although clean energy has been picking up pace in Asia, coal currently makes up more than half of the continent’s electricity generation. No Asian countries rely on wind, solar, or nuclear energy as their primary source of electricity, despite the combined share of these sources doubling over the last decade. The above comparison shows that the slight drops in the continent’s reliance on coal, natural gas, and oil in the last decade have been absorbed by wind, solar, and hydropower. The vast growth in total electricity generated, however, means that a lot more fossil fuels are being burned now (in absolute terms) than at the start of the last decade, despite their shares dropping. Following coal, natural gas comes in second place as Asia’s most used electricity source, with most of this demand coming from the Middle East and Russia.
Zooming in: China’s Big Electricity Demand
While China accounted for just 5% of global electricity demand in 1990, it is en route to account for 33% by 2025. The country is already the largest electricity producer in the world by far, annually generating nearly double the electricity produced by the second largest electricity producer in the world, the United States. With such a large demand, the current source of China’s electricity is worthy of consideration, as are its plans for its future electricity mix. Currently, China is one of the 14 Asian countries that rely on coal as its primary source of electricity. In 2021, the country drew 62% of its electricity from coal, a total of 5,339 TWh of energy. To put that into perspective, this is approximately three times all of the electricity generated in India in the same year. Following coal, the remainder of China’s electricity mix is as follows. Despite already growing by 1.5x in the last decade, China’s demand for electricity is still growing. Recent developments in the country’s clean energy infrastructure point to most of this growth being met by renewables. China does also have ambitious plans in place for its clean energy transition beyond the next few years. These include increasing its solar capacity by 667% between 2025 and 2060, as well as having wind as its primary source of electricity by 2060.
Asia’s Road to Clean Energy
According to the IEA, the world reached a new all-time high in power generation-related emissions in 2022, primarily as a result of the growth in fossil-fuel-generated electricity in the Asia Pacific. With that said, these emissions are set to plateau by 2025, with a lot of the global growth in renewables and nuclear power being seen in Asia. Currently, nuclear power is of particular interest in the continent, especially with 2022’s energy crisis highlighting the need for energy independence and security. India, for instance, is set to have an 80% growth in its nuclear electricity generation in the next two years, with Japan, South Korea, and China following suit in increasing their nuclear capacity. The road ahead also hints at other interesting insights, specifically when it comes to hydropower in Asia. With heatwaves and droughts becoming more and more commonplace as a result of climate change, the continent may be poised to learn some lessons from Europe’s record-low hydropower generation in 2022, diverting its time and resources to other forms of clean energy, like wind and solar. Whatever the future holds, one thing is clear: with ambitious plans already underway, Asia’s electricity mix may look significantly different within the next few decades.