For example, we hear from millennials all the time – many are starting to save and know they need to invest, but they’ve never had to look at a stock chart before. We also often hear from wealth managers that want to help their clients understand the financial landscape better. Today’s post explains a concept that’s important for any person looking to dive headfirst into finance.
What is a stock chart?
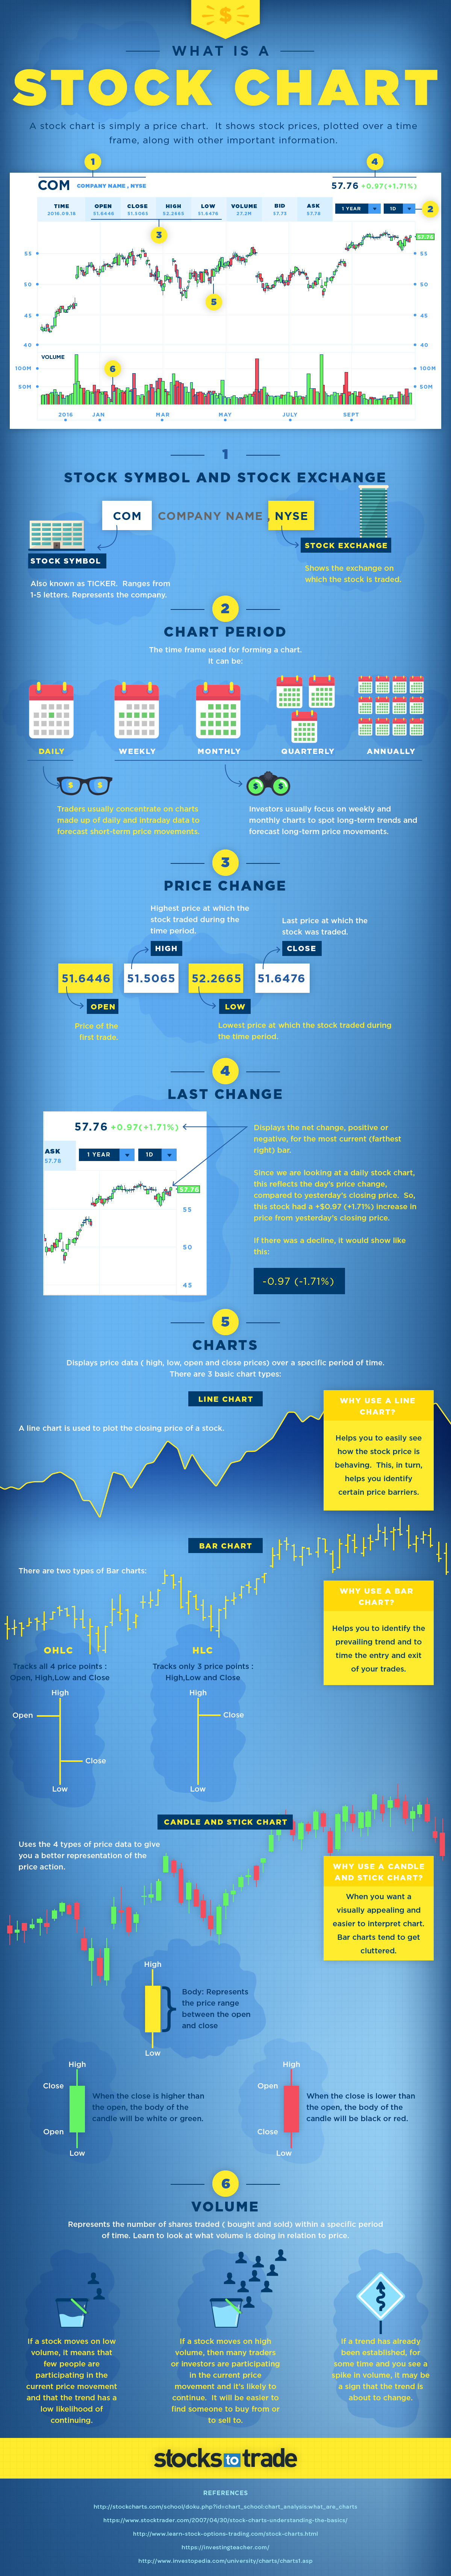
The following infographic from StocksToTrade shares the three most common types of stock charts used, and the information typically found in them. It’s the perfect step-by-step primer for someone that wants to learn the basics!
What is a stock chart? It’s simply a price chart that shows a stock’s price plotted over a time frame, and it shows a few key sets of information:
- Stock symbol and exchange The symbol for the stock, as well as the specific exchange it trades on.
- Chart period Typically daily, weekly, monthly, quarterly, or annually. Traders usually concentrate on daily and intraday data to forecast short-term price movements. Investors usually concentrate on weekly and monthly charts to spot long-term price trends.
- Price Change There are four key data points from a day’s trading: open, high, low, and close. “Open” is the price at the start of the day and “close” is the price at the end of the day. The “high” is the highest price during the session, while the “low” is the lowest.
- Last Change Displays the net change, positive or negative, from a previous price. On a daily chart, it would be from the previous day’s close.
- Types of Charts There are three basic types of charts used:
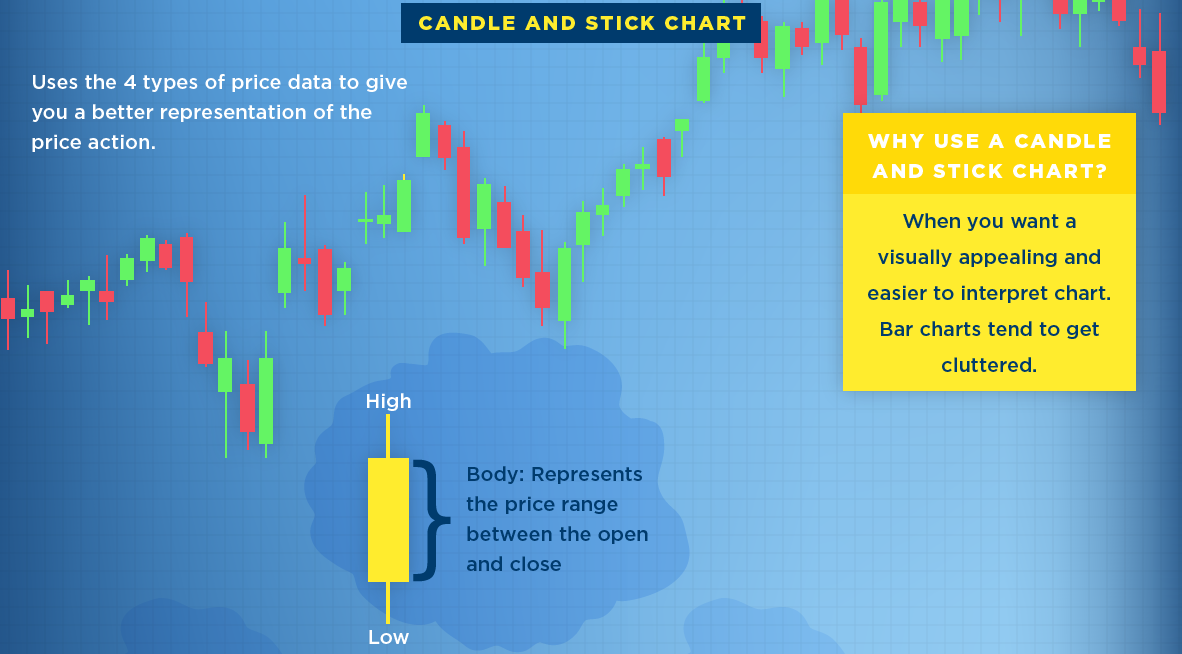
Line: Plots the closing price of a chart over time, helping you to see how a price is behaving. Bar chart: Plots the open, high, low, and close (OHLC) for each day using bars. Candle and stick chart: A visually appealing chart similar to a bar chart that shows OHLC data in an easy way.
- Volume Volume is the amount of stock that has been bought and sold within a specific period of time. If a stock moves on low volume, it means that few people are participating in the current price movement and the trend may not continue. Meanwhile, if a stock moves on high volume, it means many people are involved in the trade and the trend is more likely to continue.
on The good news is that the Federal Reserve, U.S. Treasury, and Federal Deposit Insurance Corporation are taking action to restore confidence and take the appropriate measures to help provide stability in the market. With this in mind, the above infographic from New York Life Investments looks at the factors that impact bonds, how different types of bonds have historically performed across market environments, and the current bond market volatility in a broader context.
Bond Market Returns
Bonds had a historic year in 2022, posting one of the worst returns ever recorded. As interest rates rose at the fastest pace in 40 years, it pushed bond prices lower due to their inverse relationship. In a rare year, bonds dropped 13%.
Source: FactSet, 01/02/2023.
Bond prices are only one part of a bond’s total return—the other looks at the income a bond provides. As interest rates have increased in the last year, it has driven higher bond yields in 2023.
Source: YCharts, 3/20/2023.
With this recent performance in mind, let’s look at some other key factors that impact the bond market.
Factors Impacting Bond Markets
Interest rates play a central role in bond market dynamics. This is because they affect a bond’s price. When rates are rising, existing bonds with lower rates are less valuable and prices decline. When rates are dropping, existing bonds with higher rates are more valuable and their prices rise. In March, the Federal Reserve raised rates 25 basis points to fall within the 4.75%-5.00% range, a level not seen since September 2007. Here are projections for where the federal funds rate is headed in 2023:
Federal Reserve Projection*: 5.1% Economist Projections**: 5.3%
*Based on median estimates in the March summary of quarterly economic projections.**Projections based on March 10-15 Bloomberg economist survey. Together, interest rates and the macroenvironment can have a positive or negative effect on bonds.
Positive
Here are three variables that may affect bond prices in a positive direction:
Lower Inflation: Reduces likelihood of interest rate hikes. Lower Interest Rates: When rates are falling, bond prices are typically higher. Recession: Can prompt a cut in interest rates, boosting bond prices.
Negative
On the other hand, here are variables that may negatively impact bond prices:
Higher Inflation: Can increase the likelihood of the Federal Reserve to raise interest rates. Rising Interest Rates: Interest rate hikes lead bond prices to fall. Weaker Fundamentals: When a bond’s credit risk gets worse, its price can drop. Credit risk indicates the chance of a default, the risk of a bond issuer not making interest payments within a given time period.
Bonds have been impacted by these negative factors since inflation started rising in March 2021.
Fixed Income Opportunities
Below, we show the types of bonds that have had the best performance during rising rates and recessions.
Source: Derek Horstmeyer, George Mason University 12/3/2022. As we can see, U.S. ultrashort bonds performed the best during rising rates. Mortgage bonds outperformed during recessions, averaging 11.4% returns, but with higher volatility. U.S. long-term bonds had 7.7% average returns, the best across all market conditions. In fact, they were also a close second during recessions. When rates are rising, ultrashort bonds allow investors to capture higher rates when they mature, often with lower historical volatility.
A Closer Look at Bond Market Volatility
While bond market volatility has jumped this year, current dislocations may provide investment opportunities. Bond dislocations allow investors to buy at lower prices, factoring in that the fundamental quality of the bond remains strong. With this in mind, here are two areas of the bond market that may provide opportunities for investors:
Investment-Grade Corporate Bonds: Higher credit quality makes them potentially less vulnerable to increasing interest rates. Intermediate Bonds (2-10 Years): Allow investors to lock in higher rates.
Both types of bonds focus on quality and capturing higher yields when faced with challenging market conditions.
Finding the Upside
Much of the volatility seen in the banking sector was due to banks buying bonds during the pandemic—or even earlier—at a time when interest rates were historically low. Since then, rates have climbed considerably. Should rates moderate or stop increasing, this may present better market conditions for bonds. In this way, today’s steep discount in bond markets may present an attractive opportunity for price appreciation. At the same time, investors can potentially lock in strong yields as inflation may subside in the coming years ahead. Learn more about bond investing strategies with New York Life Investments.