Starting in late-November, the holiday shopping season officially kicks into high gear – and it’s the beginning of a month-long stretch that can either make or break retailers.
Black Friday Numbers
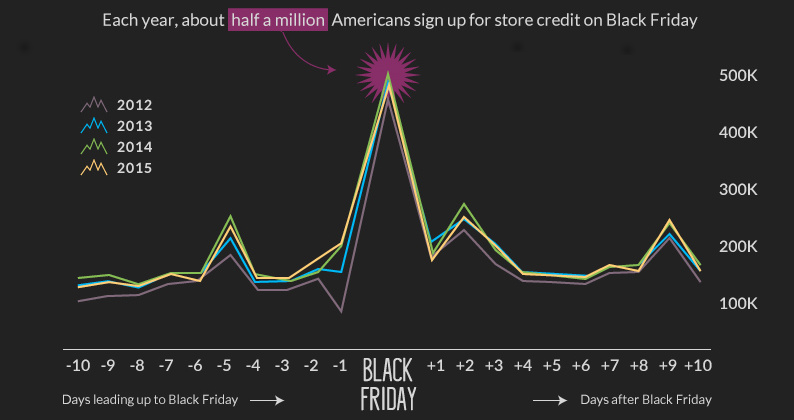
Today’s infographic comes to us from AppInstitute, and it breaks down the numbers behind Black Friday, the centerpiece of the shopping extravaganza for retailers in the United States.
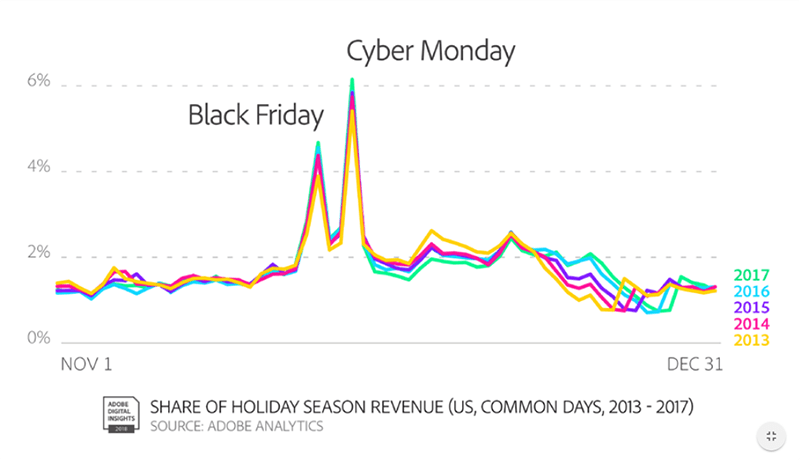
In totality, the holiday season generated $688 billion of revenue for retailers in the United States in 2017 – and $108.2 billion of this came from online purchases, which are seeing double-digit growth each year. Impressively, about 15% of all online holiday revenue comes in the four-day span between Black Friday and Cyber Monday. The two days (Black Friday, Cyber Monday) are the two highest volume online shopping days of the year.
Source: Adobe
Online or Offline
Do shoppers take advantage of deals at home or in store? It appears to be a mix of both, according to comprehensive data from Adobe for the 2017 shopping season:
16% shopped entirely in stores 29% shopped mostly in stores, and a little online 26% shopped equally in stores and online 20% shopped mostly online, and a little in stores 9% shopped entirely online
This means for most people, shopping is an omni-channel experience – they are comparing options in their heads between online (desktop, mobile) and offline channels.
An Even Bigger Day For Online Sales
While Black Friday is an impressive kickoff day for online and offline sales, there is an even bigger one-day online equivalent in China. On Black Friday, online sales total about $5 billion – this is just a drop in the bucket compared to Alibaba’s Single’s Day, which sold $30.8 billion in a 24-hour period on November 11, 2018. On Single’s Day in 2018, it took fewer than 90 seconds to hit $1 billion in online sales.
on These are in the form of Treasury securities, some of the most liquid assets worldwide. Central banks use them for foreign exchange reserves and private investors flock to them during flights to safety thanks to their perceived low default risk. Beyond these reasons, foreign investors may buy Treasuries as a store of value. They are often used as collateral during certain international trade transactions, or countries can use them to help manage exchange rate policy. For example, countries may buy Treasuries to protect their currency’s exchange rate from speculation. In the above graphic, we show the foreign holders of the U.S. national debt using data from the U.S. Department of the Treasury.
Top Foreign Holders of U.S. Debt
With $1.1 trillion in Treasury holdings, Japan is the largest foreign holder of U.S. debt. Japan surpassed China as the top holder in 2019 as China shed over $250 billion, or 30% of its holdings in four years. This bond offloading by China is the one way the country can manage the yuan’s exchange rate. This is because if it sells dollars, it can buy the yuan when the currency falls. At the same time, China doesn’t solely use the dollar to manage its currency—it now uses a basket of currencies. Here are the countries that hold the most U.S. debt: As the above table shows, the United Kingdom is the third highest holder, at over $655 billion in Treasuries. Across Europe, 13 countries are notable holders of these securities, the highest in any region, followed by Asia-Pacific at 11 different holders. A handful of small nations own a surprising amount of U.S. debt. With a population of 70,000, the Cayman Islands own a towering amount of Treasury bonds to the tune of $284 billion. There are more hedge funds domiciled in the Cayman Islands per capita than any other nation worldwide. In fact, the four smallest nations in the visualization above—Cayman Islands, Bermuda, Bahamas, and Luxembourg—have a combined population of just 1.2 million people, but own a staggering $741 billion in Treasuries.
Interest Rates and Treasury Market Dynamics
Over 2022, foreign demand for Treasuries sank 6% as higher interest rates and a strong U.S. dollar made owning these bonds less profitable. This is because rising interest rates on U.S. debt makes the present value of their future income payments lower. Meanwhile, their prices also fall. As the chart below shows, this drop in demand is a sharp reversal from 2018-2020, when demand jumped as interest rates hovered at historic lows. A similar trend took place in the decade after the 2008-09 financial crisis when U.S. debt holdings effectively tripled from $2 to $6 trillion.
Driving this trend was China’s rapid purchase of Treasuries, which ballooned from $100 billion in 2002 to a peak of $1.3 trillion in 2013. As the country’s exports and output expanded, it sold yuan and bought dollars to help alleviate exchange rate pressure on its currency. Fast-forward to today, and global interest-rate uncertainty—which in turn can impact national currency valuations and therefore demand for Treasuries—continues to be a factor impacting the future direction of foreign U.S. debt holdings.