As in any new and rapidly-growing market, this kind of investor intent and the overall feeling of market sentiment matters a lot. That’s because there are no historical averages or ratios to apply as baselines for value, and if things head south there is always the possibility of a mass exodus.
Buy, Hodl, and Prosper?
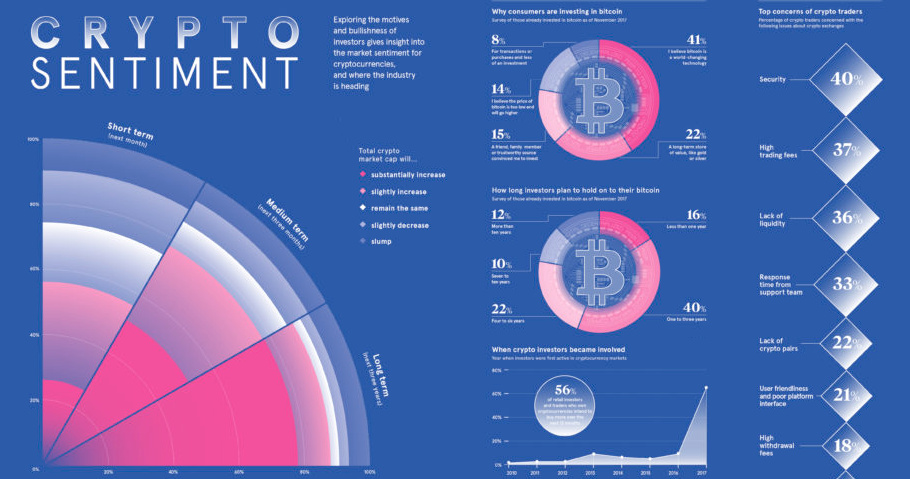
Today’s infographic comes to us from Raconteur, and it helps map out the future price expectations of crypto investors, along with how long they plan to hold onto their digital assets. But before we get to that, let’s look at why investors bought into the market in the first place: When did people get into the market? More than 60% of investors got involved in cryptocurrency in 2017, and 56% of investors that hold crypto plan to buy more in the next 12 months.
Future Expectations
What do people expect crypto prices to do in the future, and how long are investors willing to hold? According to a survey of 1,800 crypto investors around the world at the end of March 2018, a whopping 77.9% see the crypto market gaining more than 30% in value over the next three years. Meanwhile, another poll from November 2017 asked investors how long they will hold onto their assets: Only 16% of respondents planned to sell within the next year, and 44% of respondents said they’d hold onto Bitcoin for four or more years.
Concerns About Exchanges
Exchanges are the lifeblood for buying or selling cryptocurrency – so what are the major concerns held by investors about them? Security continues to be a topical issue for traders, which is not surprising since it’s estimated that $1.2 billion of crypto has been stolen since 2017. Other issues like high trading fees and the lack of liquidity and lack of currency pairs also poll high. on These are in the form of Treasury securities, some of the most liquid assets worldwide. Central banks use them for foreign exchange reserves and private investors flock to them during flights to safety thanks to their perceived low default risk. Beyond these reasons, foreign investors may buy Treasuries as a store of value. They are often used as collateral during certain international trade transactions, or countries can use them to help manage exchange rate policy. For example, countries may buy Treasuries to protect their currency’s exchange rate from speculation. In the above graphic, we show the foreign holders of the U.S. national debt using data from the U.S. Department of the Treasury.
Top Foreign Holders of U.S. Debt
With $1.1 trillion in Treasury holdings, Japan is the largest foreign holder of U.S. debt. Japan surpassed China as the top holder in 2019 as China shed over $250 billion, or 30% of its holdings in four years. This bond offloading by China is the one way the country can manage the yuan’s exchange rate. This is because if it sells dollars, it can buy the yuan when the currency falls. At the same time, China doesn’t solely use the dollar to manage its currency—it now uses a basket of currencies. Here are the countries that hold the most U.S. debt: As the above table shows, the United Kingdom is the third highest holder, at over $655 billion in Treasuries. Across Europe, 13 countries are notable holders of these securities, the highest in any region, followed by Asia-Pacific at 11 different holders. A handful of small nations own a surprising amount of U.S. debt. With a population of 70,000, the Cayman Islands own a towering amount of Treasury bonds to the tune of $284 billion. There are more hedge funds domiciled in the Cayman Islands per capita than any other nation worldwide. In fact, the four smallest nations in the visualization above—Cayman Islands, Bermuda, Bahamas, and Luxembourg—have a combined population of just 1.2 million people, but own a staggering $741 billion in Treasuries.
Interest Rates and Treasury Market Dynamics
Over 2022, foreign demand for Treasuries sank 6% as higher interest rates and a strong U.S. dollar made owning these bonds less profitable. This is because rising interest rates on U.S. debt makes the present value of their future income payments lower. Meanwhile, their prices also fall. As the chart below shows, this drop in demand is a sharp reversal from 2018-2020, when demand jumped as interest rates hovered at historic lows. A similar trend took place in the decade after the 2008-09 financial crisis when U.S. debt holdings effectively tripled from $2 to $6 trillion.
Driving this trend was China’s rapid purchase of Treasuries, which ballooned from $100 billion in 2002 to a peak of $1.3 trillion in 2013. As the country’s exports and output expanded, it sold yuan and bought dollars to help alleviate exchange rate pressure on its currency. Fast-forward to today, and global interest-rate uncertainty—which in turn can impact national currency valuations and therefore demand for Treasuries—continues to be a factor impacting the future direction of foreign U.S. debt holdings.