Discussions are still early, and it’s tough to predict the exact policies that will be affected until negotiations reach their peak. However, until that point, there is one simple barometer that can give you an idea of how you may be affected: how much business does your state do with Canada, and how much is with Mexico?
States Tied to Canada
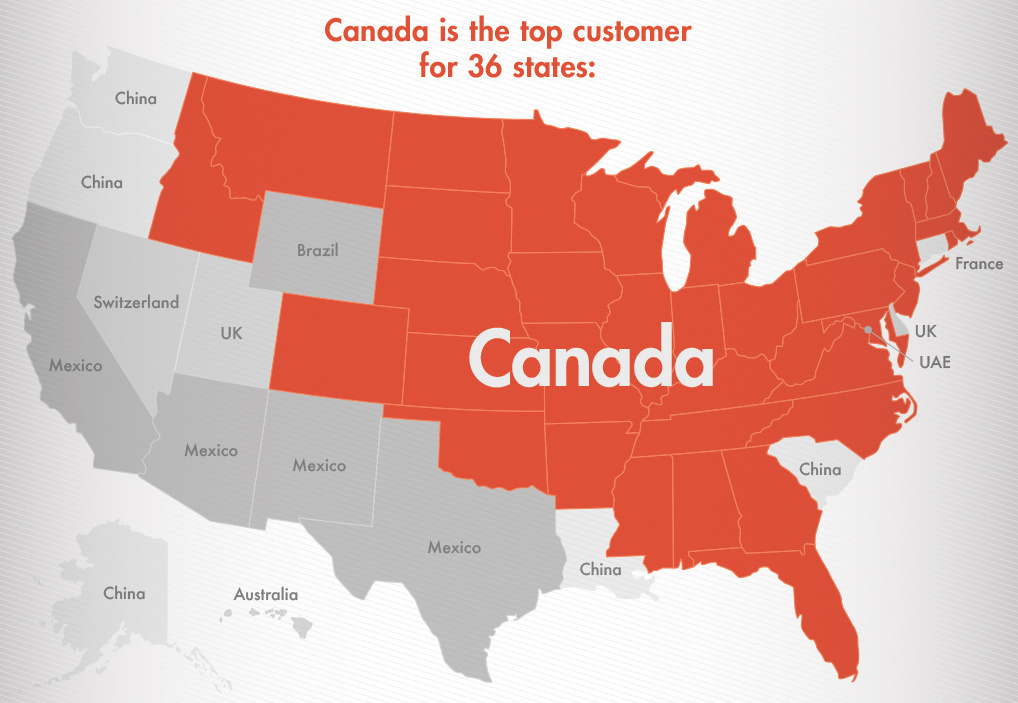
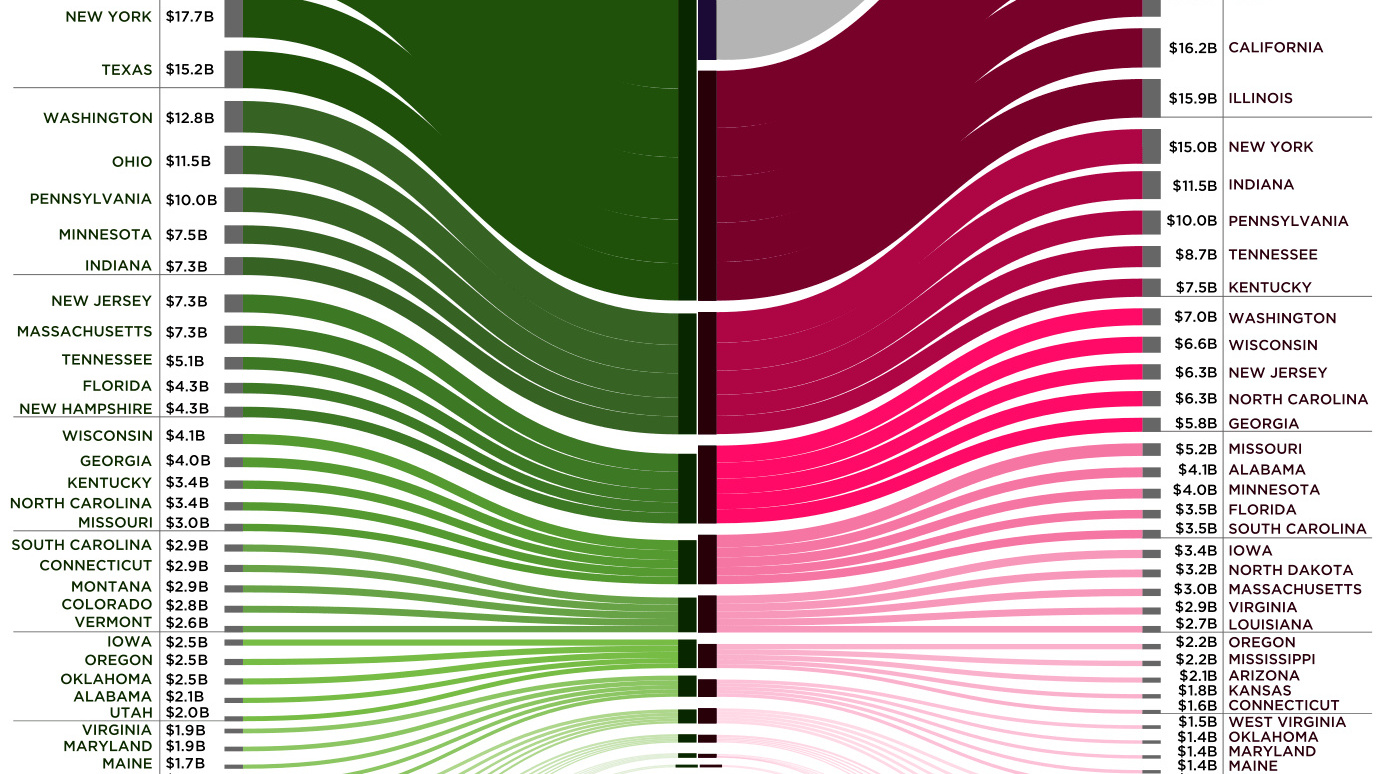
Today’s visualization from HowMuch.net focuses specifically on how close each state economy is tied to Canada. Using a flow diagram, it breaks down $544.9 billion of bilateral trade into the imports and exports of states, ranked by the total amount of goods sent or received from their neighbors to the north. Here’s a breakdown of the states that export the most to Canada, both in percentage terms and dollars: On average, 15.0% of all U.S. international trade is with Canada – but as you can see above, some states are clearly more reliant on this trade than others. To put this in wider perspective, here’s a map we published as a part of a post on the world’s closest trade relationship. It shows that Canada is the top international destination of exports for 36 different states:
Imported from up North
Canada also sends a great deal of goods to the United States, as well. The following states are the ones that import the most goods from Canada, and any changes to NAFTA could potentially impact these supply chains. If prices increase through tariffs, these businesses would have to either suck up the additional costs, or seek alternative inputs from other places.
Putting it Together
In percentage terms, northern states like North Dakota, Maine, Michigan, Vermont, and Montana are the most reliant on Canada for international trade both ways. In many of those states, Canadian trade also tends to be large as a percentage of Gross State Product (GSP): Michigan (15%), Vermont (14%), Montana (9%), North Dakota (8%), and New Hampshire (7%) are the most affected using this criteria. Meanwhile, states like Illinois, Indiana, Ohio, Kentucky, and Maine each trade with Canada for 6% of their total GSP value. By using dollars as a metric, Michigan is the state that will be impacted the most – it imports $48.3 billion, while exporting $23.7 billion to Canada. on These are in the form of Treasury securities, some of the most liquid assets worldwide. Central banks use them for foreign exchange reserves and private investors flock to them during flights to safety thanks to their perceived low default risk. Beyond these reasons, foreign investors may buy Treasuries as a store of value. They are often used as collateral during certain international trade transactions, or countries can use them to help manage exchange rate policy. For example, countries may buy Treasuries to protect their currency’s exchange rate from speculation. In the above graphic, we show the foreign holders of the U.S. national debt using data from the U.S. Department of the Treasury.
Top Foreign Holders of U.S. Debt
With $1.1 trillion in Treasury holdings, Japan is the largest foreign holder of U.S. debt. Japan surpassed China as the top holder in 2019 as China shed over $250 billion, or 30% of its holdings in four years. This bond offloading by China is the one way the country can manage the yuan’s exchange rate. This is because if it sells dollars, it can buy the yuan when the currency falls. At the same time, China doesn’t solely use the dollar to manage its currency—it now uses a basket of currencies. Here are the countries that hold the most U.S. debt: As the above table shows, the United Kingdom is the third highest holder, at over $655 billion in Treasuries. Across Europe, 13 countries are notable holders of these securities, the highest in any region, followed by Asia-Pacific at 11 different holders. A handful of small nations own a surprising amount of U.S. debt. With a population of 70,000, the Cayman Islands own a towering amount of Treasury bonds to the tune of $284 billion. There are more hedge funds domiciled in the Cayman Islands per capita than any other nation worldwide. In fact, the four smallest nations in the visualization above—Cayman Islands, Bermuda, Bahamas, and Luxembourg—have a combined population of just 1.2 million people, but own a staggering $741 billion in Treasuries.
Interest Rates and Treasury Market Dynamics
Over 2022, foreign demand for Treasuries sank 6% as higher interest rates and a strong U.S. dollar made owning these bonds less profitable. This is because rising interest rates on U.S. debt makes the present value of their future income payments lower. Meanwhile, their prices also fall. As the chart below shows, this drop in demand is a sharp reversal from 2018-2020, when demand jumped as interest rates hovered at historic lows. A similar trend took place in the decade after the 2008-09 financial crisis when U.S. debt holdings effectively tripled from $2 to $6 trillion.
Driving this trend was China’s rapid purchase of Treasuries, which ballooned from $100 billion in 2002 to a peak of $1.3 trillion in 2013. As the country’s exports and output expanded, it sold yuan and bought dollars to help alleviate exchange rate pressure on its currency. Fast-forward to today, and global interest-rate uncertainty—which in turn can impact national currency valuations and therefore demand for Treasuries—continues to be a factor impacting the future direction of foreign U.S. debt holdings.