China’s economic prowess is one of these new paradigms that has emerged, but many people still can’t really wrap their heads around the scale or scope of it. It’s happened suddenly, and the ramifications are extremely relevant to our investments and understanding. Here’s four maps on China’s trade dominance that will help you think differently about the world:
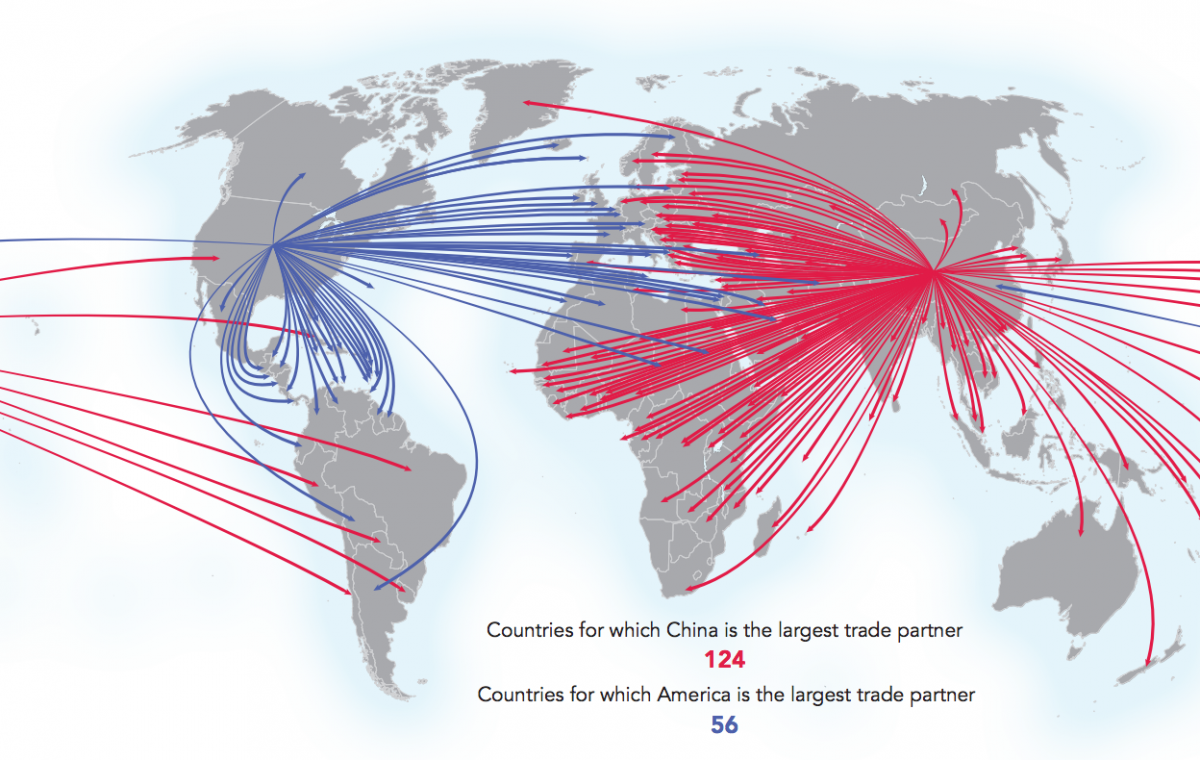
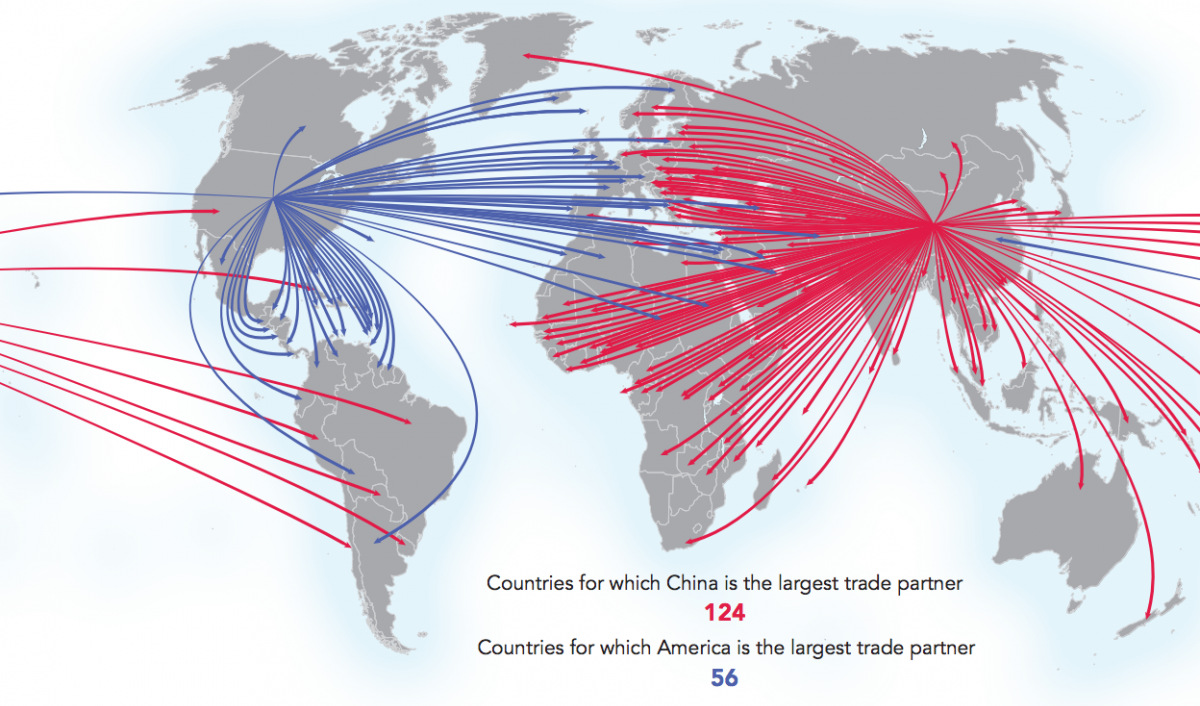
China is the world’s #1 trade partner
Image courtesy of: Connectography The United States is the number one trading partner for 56 countries, with important relationships throughout North America, South America, and Western Europe. Meanwhile, China is the top partner for 124 countries, dominating trade in Asia, Eastern Europe, Africa, and Australia.
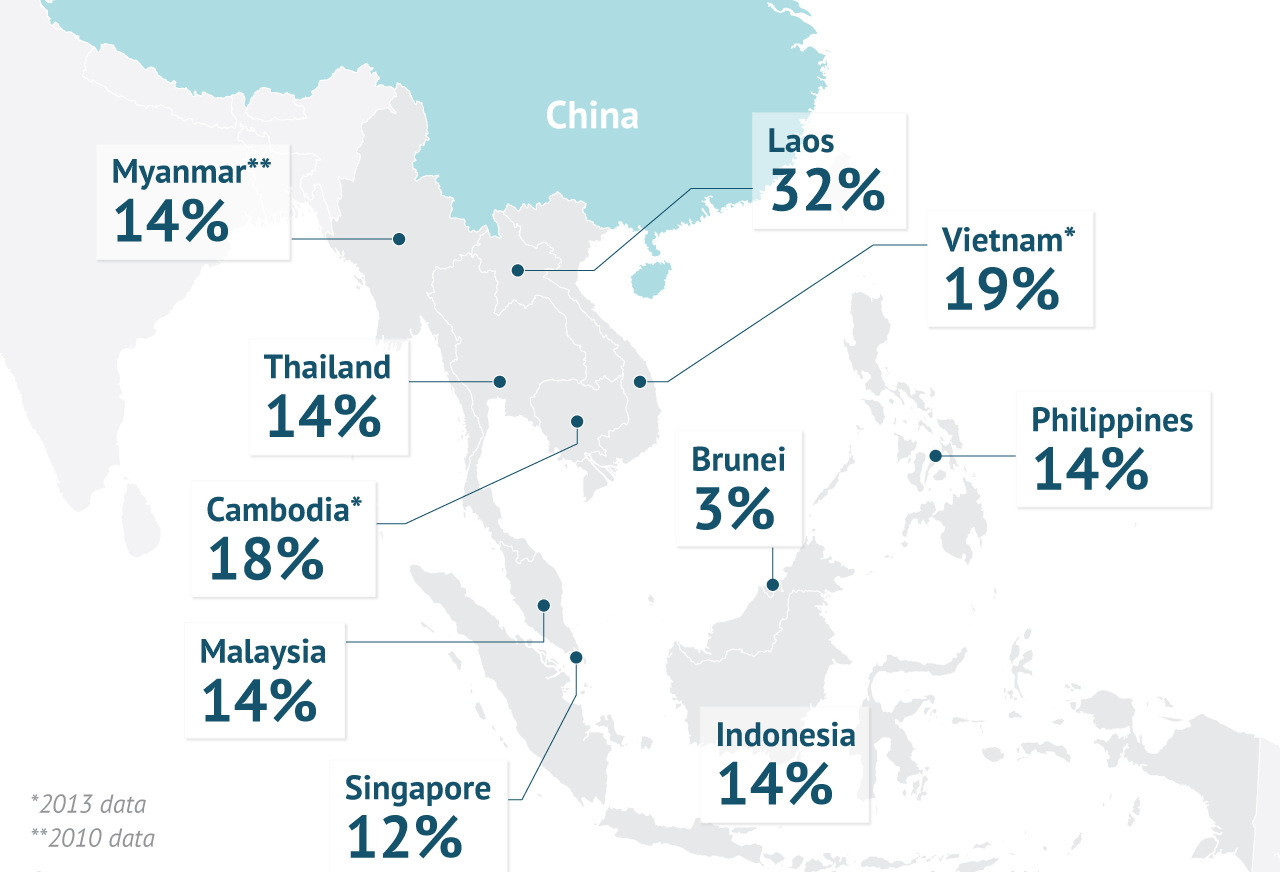
China’s Sphere of Influence
This map shows the portion of trade conducted by each country with China in Southeast Asia.
Image courtesy of: Stratfor The influence that China has with nations in Southeast Asia is significant. Most trade is in double-digit percentages, and China views this as its immediate sphere of influence. Throughout history, territories in this region would even pay tribute to China to gain access to trade. “In East Asia’s tribute system, China was the superior state, and many of its neighboring states were vassal states, and they maintained a relationship of tribute and rewards,” writes Liu Mingfu in The China Dream, a popular book about China’s plans to return to power. Maintaining influence in Southeast Asia is part of the reason that Beijing is posturing in the South China Sea. In fact, China’s coastguard is growing so fast that in 10 years it will have more tonnage than all of the coastguards in Southeast Asia, the United States, and Japan combined.
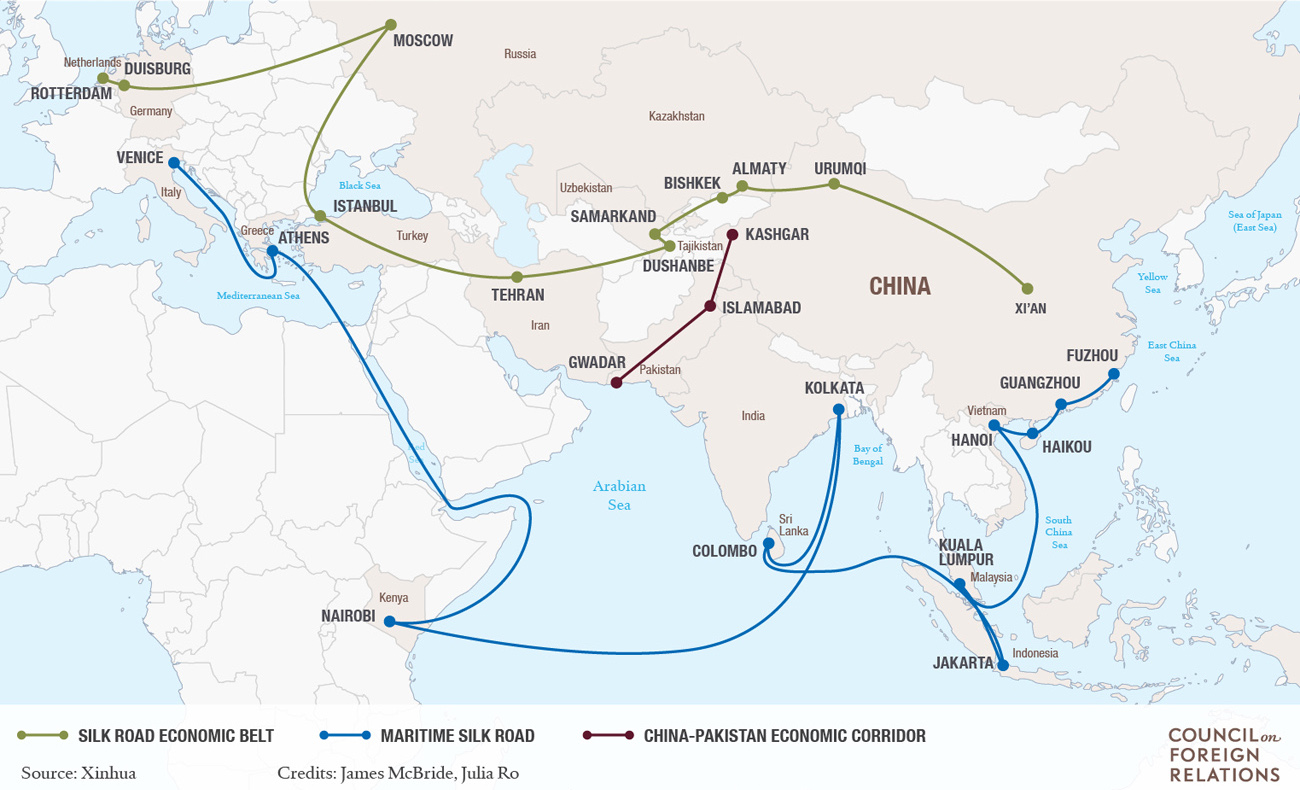
Building a New Silk Road for Chinese Trade
Image courtesy of: Council of Foreign Relations China seeks to increase trade ties with Asia and Europe even further by building a new Silk Road that puts even Marco Polo’s route to shame. The Chinese transcontinental network, a massive infrastructure project pegged for completion by 2025, is expected to bring down overland travel time from Beijing to London to just two days. Currently, it takes 15 days for the journey. The project’s aim is to shorten the time of bulk consumer-goods transport to Europe, while unlocking the economic potential behind Eurasian cities from Almaty to Tehran. The new Silk Road will include at least one high-speed line that goes 320 km/h, and the network will help to link up 70% of the world’s population in roughly 40 countries.
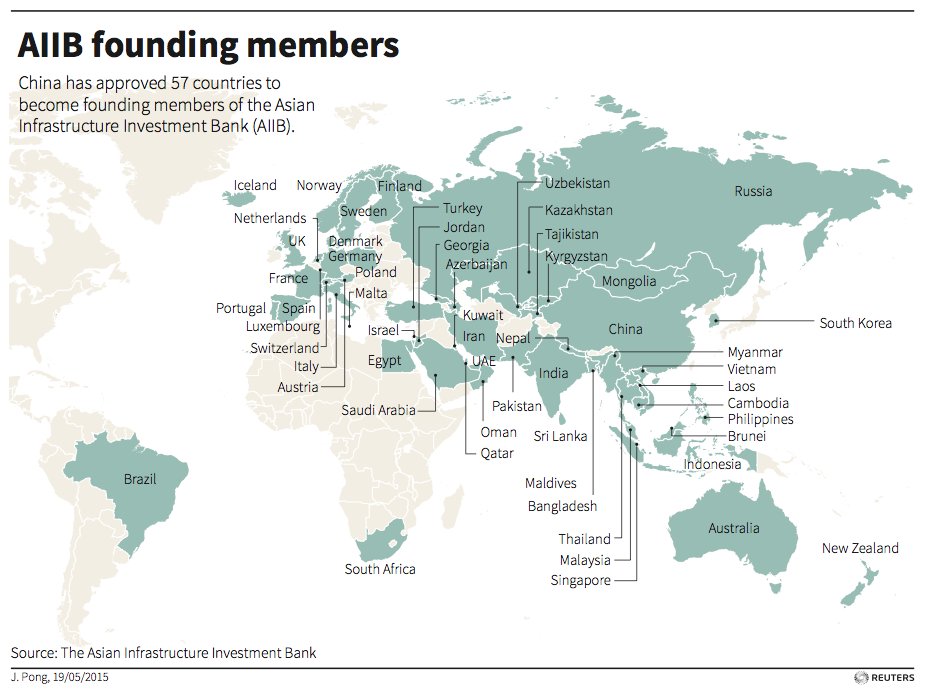
Infrastructure Override
You may have heard of the AIIB (Asian Infrastructure Investment Bank), which was officially launched at the end of last year. Initially proposed by China, the bank now has over a $100 billion of capitalization and 57 founding member states.
Image courtesy of: Reuters While this shows China’s push for infrastructure especially to coincide with its new Silk Road, there is another very interesting detail: Beijing controls 26.06% of the votes, essentially giving it veto power as most bank decisions need 75% of the votes to pass. In other words, only infrastructure projects that benefit Chinese trade will likely get the nod from Beijing.
on The good news is that the Federal Reserve, U.S. Treasury, and Federal Deposit Insurance Corporation are taking action to restore confidence and take the appropriate measures to help provide stability in the market. With this in mind, the above infographic from New York Life Investments looks at the factors that impact bonds, how different types of bonds have historically performed across market environments, and the current bond market volatility in a broader context.
Bond Market Returns
Bonds had a historic year in 2022, posting one of the worst returns ever recorded. As interest rates rose at the fastest pace in 40 years, it pushed bond prices lower due to their inverse relationship. In a rare year, bonds dropped 13%.
Source: FactSet, 01/02/2023.
Bond prices are only one part of a bond’s total return—the other looks at the income a bond provides. As interest rates have increased in the last year, it has driven higher bond yields in 2023.
Source: YCharts, 3/20/2023.
With this recent performance in mind, let’s look at some other key factors that impact the bond market.
Factors Impacting Bond Markets
Interest rates play a central role in bond market dynamics. This is because they affect a bond’s price. When rates are rising, existing bonds with lower rates are less valuable and prices decline. When rates are dropping, existing bonds with higher rates are more valuable and their prices rise. In March, the Federal Reserve raised rates 25 basis points to fall within the 4.75%-5.00% range, a level not seen since September 2007. Here are projections for where the federal funds rate is headed in 2023:
Federal Reserve Projection*: 5.1% Economist Projections**: 5.3%
*Based on median estimates in the March summary of quarterly economic projections.**Projections based on March 10-15 Bloomberg economist survey. Together, interest rates and the macroenvironment can have a positive or negative effect on bonds.
Positive
Here are three variables that may affect bond prices in a positive direction:
Lower Inflation: Reduces likelihood of interest rate hikes. Lower Interest Rates: When rates are falling, bond prices are typically higher. Recession: Can prompt a cut in interest rates, boosting bond prices.
Negative
On the other hand, here are variables that may negatively impact bond prices:
Higher Inflation: Can increase the likelihood of the Federal Reserve to raise interest rates. Rising Interest Rates: Interest rate hikes lead bond prices to fall. Weaker Fundamentals: When a bond’s credit risk gets worse, its price can drop. Credit risk indicates the chance of a default, the risk of a bond issuer not making interest payments within a given time period.
Bonds have been impacted by these negative factors since inflation started rising in March 2021.
Fixed Income Opportunities
Below, we show the types of bonds that have had the best performance during rising rates and recessions.
Source: Derek Horstmeyer, George Mason University 12/3/2022. As we can see, U.S. ultrashort bonds performed the best during rising rates. Mortgage bonds outperformed during recessions, averaging 11.4% returns, but with higher volatility. U.S. long-term bonds had 7.7% average returns, the best across all market conditions. In fact, they were also a close second during recessions. When rates are rising, ultrashort bonds allow investors to capture higher rates when they mature, often with lower historical volatility.
A Closer Look at Bond Market Volatility
While bond market volatility has jumped this year, current dislocations may provide investment opportunities. Bond dislocations allow investors to buy at lower prices, factoring in that the fundamental quality of the bond remains strong. With this in mind, here are two areas of the bond market that may provide opportunities for investors:
Investment-Grade Corporate Bonds: Higher credit quality makes them potentially less vulnerable to increasing interest rates. Intermediate Bonds (2-10 Years): Allow investors to lock in higher rates.
Both types of bonds focus on quality and capturing higher yields when faced with challenging market conditions.
Finding the Upside
Much of the volatility seen in the banking sector was due to banks buying bonds during the pandemic—or even earlier—at a time when interest rates were historically low. Since then, rates have climbed considerably. Should rates moderate or stop increasing, this may present better market conditions for bonds. In this way, today’s steep discount in bond markets may present an attractive opportunity for price appreciation. At the same time, investors can potentially lock in strong yields as inflation may subside in the coming years ahead. Learn more about bond investing strategies with New York Life Investments.