Earnings Scoreboard: A Turbulent Week in Tech [Chart]
The Chart of the Week is a weekly Visual Capitalist feature on Fridays. For many blue chip companies, earnings season can end up being relatively dry. For example, yesterday MasterCard reported an earnings “beat” of $0.86 earnings per share (EPS) compared to the $0.85 consensus. The stock inched up 0.7% in afternoon trading and now it’s back down today. In other words, it’s business as usual again. If a company shows signs that it is growing slower than expected, investors punish the stock with the expectation of a ripple effect on future cash flows.
The Tech Scoreboard
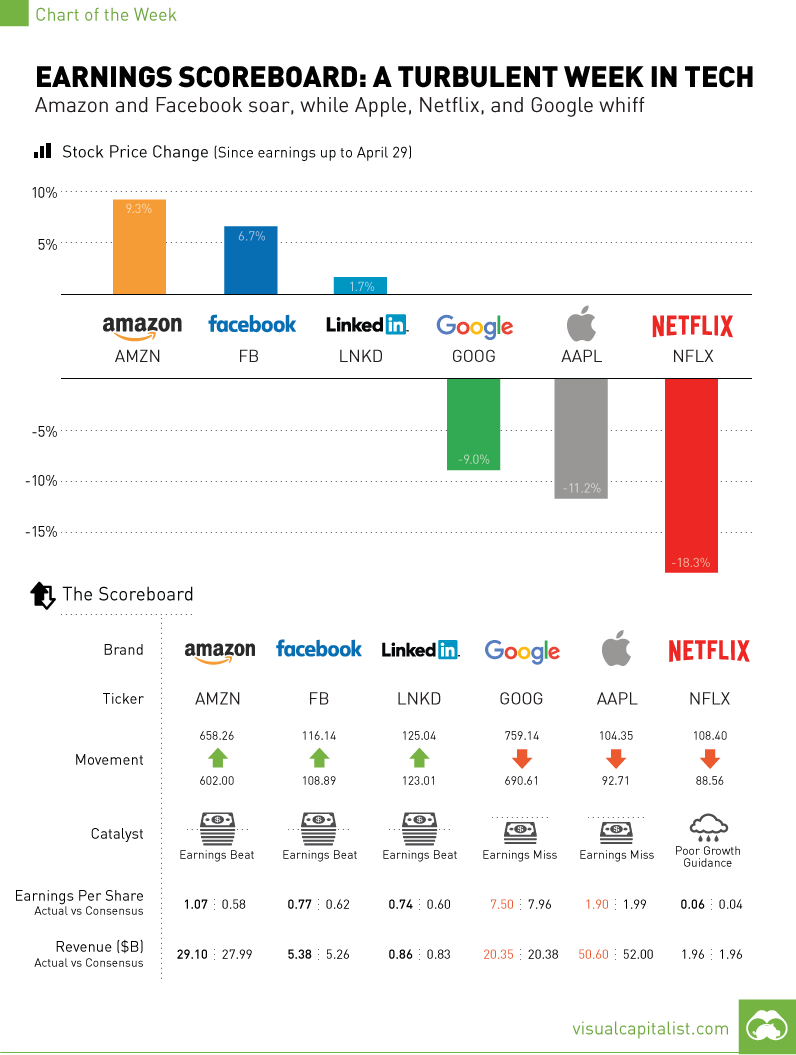
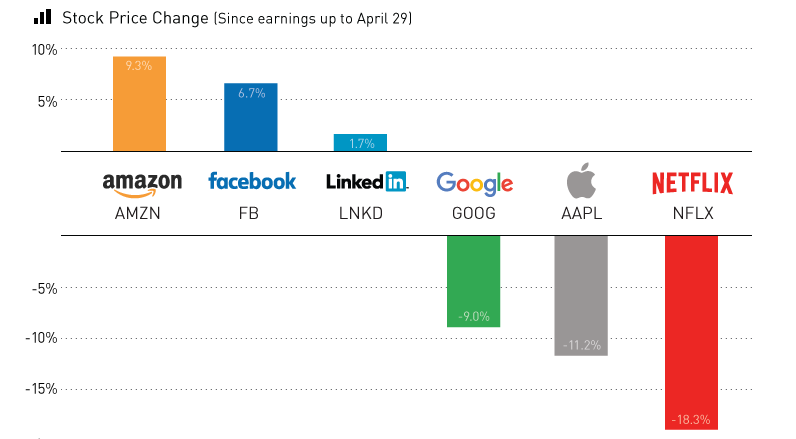
The last week has been particularly eventful on the tech earnings front, and Jim Cramer’s “FANG” stocks were the center of the action. After buoying the market for much of 2015, the stocks went their separate directions.
Netflix kicked it off with a huge whiff. While revenues and EPS were on track for the quarter, its guidance on subscriber growth was the ringing of a big alarm bell. Wall Street was looking for the company to add 3.5 million international subscribers in Q2, but Netflix said it would only be adding two million. The stock has tanked spectacularly ever since, losing -18.3% in value.
Alphabet and Apple, the two most valuable public companies in the world by market capitalization, also showed signs of a struggle. Both stocks are now down close to -10% from pre-earnings, shedding a combined $100 billion in value. Apple posted its first year-over-year decline in quarterly revenue since 2003, while Google’s parent company fell short on both top and bottom lines. Co-founders Sergey Brin and Larry Page have lost a combined $3.8 billion in wealth since the report.
While this is all very dire for the tech sector, Jeff Bezos and Mark Zuckerberg came to the rescue.
Facebook also helped save face for Silicon Valley, and shares have now hit an all-time high as the company beat projected revenues and earnings.
on
Last year, stock and bond returns tumbled after the Federal Reserve hiked interest rates at the fastest speed in 40 years. It was the first time in decades that both asset classes posted negative annual investment returns in tandem.
Over four decades, this has happened 2.4% of the time across any 12-month rolling period.
To look at how various stock and bond asset allocations have performed over history—and their broader correlations—the above graphic charts their best, worst, and average returns, using data from Vanguard.
How Has Asset Allocation Impacted Returns?
Based on data between 1926 and 2019, the table below looks at the spectrum of market returns of different asset allocations:
We can see that a portfolio made entirely of stocks returned 10.3% on average, the highest across all asset allocations. Of course, this came with wider return variance, hitting an annual low of -43% and a high of 54%.
A traditional 60/40 portfolio—which has lost its luster in recent years as low interest rates have led to lower bond returns—saw an average historical return of 8.8%. As interest rates have climbed in recent years, this may widen its appeal once again as bond returns may rise.
Meanwhile, a 100% bond portfolio averaged 5.3% in annual returns over the period. Bonds typically serve as a hedge against portfolio losses thanks to their typically negative historical correlation to stocks.
A Closer Look at Historical Correlations
To understand how 2022 was an outlier in terms of asset correlations we can look at the graphic below:
The last time stocks and bonds moved together in a negative direction was in 1969. At the time, inflation was accelerating and the Fed was hiking interest rates to cool rising costs. In fact, historically, when inflation surges, stocks and bonds have often moved in similar directions. Underscoring this divergence is real interest rate volatility. When real interest rates are a driving force in the market, as we have seen in the last year, it hurts both stock and bond returns. This is because higher interest rates can reduce the future cash flows of these investments. Adding another layer is the level of risk appetite among investors. When the economic outlook is uncertain and interest rate volatility is high, investors are more likely to take risk off their portfolios and demand higher returns for taking on higher risk. This can push down equity and bond prices. On the other hand, if the economic outlook is positive, investors may be willing to take on more risk, in turn potentially boosting equity prices.
Current Investment Returns in Context
Today, financial markets are seeing sharp swings as the ripple effects of higher interest rates are sinking in. For investors, historical data provides insight on long-term asset allocation trends. Over the last century, cycles of high interest rates have come and gone. Both equity and bond investment returns have been resilient for investors who stay the course.