The answer is “no” – and it turns out that the actual statistical relationship between income and wealth is surprisingly low.
Graphing Income and Wealth
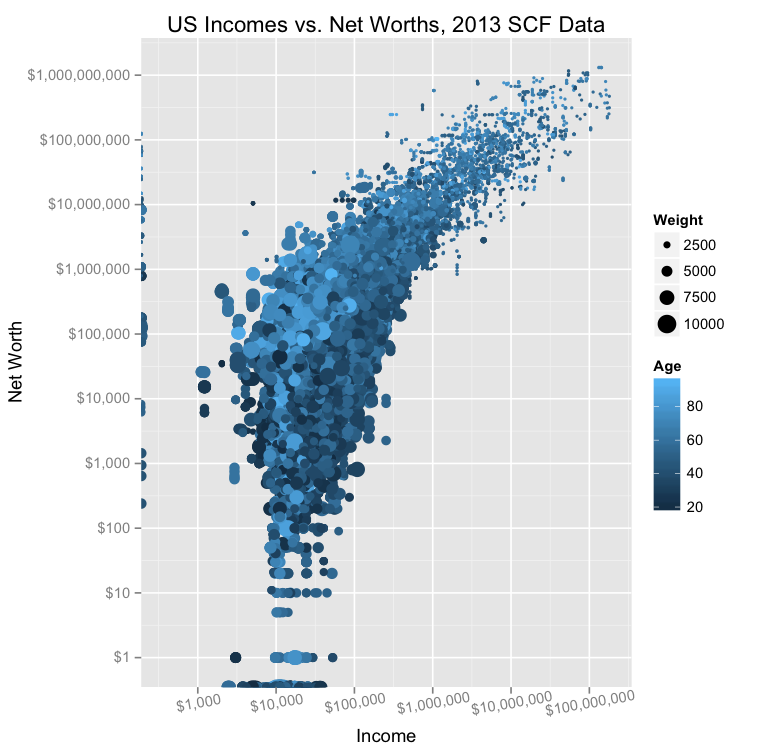
The folks at Don’t Quit Your Day Job did an analysis of federal data on income and net worth, and the results can be summarized with this visualization:
The X axis shows annual income, and the Y axis shows net worth. It’s also worth noting that both scales are logarithmic, so they the intervals increase by a factor of 10x. The above data has some correlation, but it’s not as much as you’d likely think. The R-squared value, a measure used to express the relationship between two sets of data, is only 33%. In other words, one variable only helps to “explain” the other about a third of the time, which suggests just a partial relationship between income and net worth. Although this minimal relationship may seem counterintuitive to some people, it all makes more sense when you consider that income is just one factor that could contribute to overall net worth. Income is important, but spending habits, savings, and investments are also important to building wealth over time.
The Age and Experience Factor
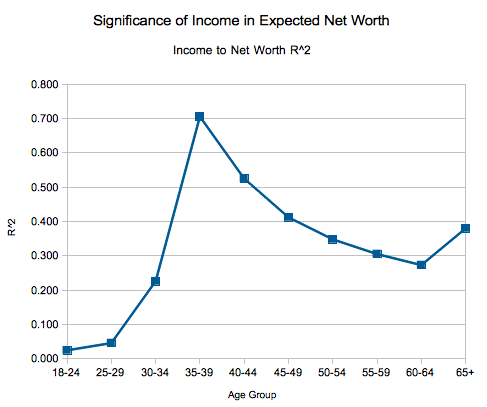
Now, here’s the really interesting part: income is a better predictor for the wealth of people in certain age groups, and a worse predictor for others. Here’s another chart from DQYDJ:
For younger people, there seems to be hardly any relationship between income and wealth. Later on, in the late-30s, the relationship seems to peak. During this age period, income is actually a very good predictor of someone’s net worth. Finally, from there, the relationship seems to decrease over time. The older you get, the less likely income is a useful predictor of actual wealth. This makes sense for a variety of reasons, but perhaps one of the more important one is how that money is spent. People that are disciplined savers and smart investors will increase their net worth over time, regardless of their income. on To see how the minimum wage differs around the world, we’ve visualized data from Picodi, which includes values for 67 countries as of January 2023.
Monthly Minimum Wage, by Country
The following table includes all of the data used in this infographic. Each value represents the monthly minimum wage a full-time worker would receive in each country. Picodi states that these figures are net of taxes and have been converted to USD. Generally speaking, developed countries have a higher cost of living, and thus require a higher minimum wage. Two outliers in this dataset are Argentina and Turkey, which have increased their minimum wages by 100% or more from January 2022 levels. Turkey is suffering from an ongoing currency crisis, with the lira losing over 40% of its value in 2021. Prices of basic goods have increased considerably as the Turkish lira continues to plummet. In fact, a 2022 survey found that 70% of people in Turkey were struggling to pay for food. Argentina, South America’s second-biggest economy, is also suffering from very high inflation. In response, the country announced three minimum wage increases throughout 2022.
Minimum Wage in the U.S.
Within the U.S., minimum wage varies significantly by state. We’ve visualized each state’s basic minimum rate (hourly) using January 2023 data from the U.S. Department of Labor.
2023-03-17 Update: This map was updated to fix several incorrect values. We apologize for any confusion this may have caused. America’s federal minimum wage has remained unchanged since 2009 at $7.25 per hour. Each state is allowed to set their own minimum wage, as long as it’s higher than the federal minimum. In states that do not set their own minimum, the federal minimum applies. If we assume someone works 40 hours a week, the federal minimum wage of $7.25 translates to an annual figure of just $15,080 before taxes. California’s minimum wage of $15.50 translates to $32,240 before taxes. For further perspective, check out our 2022 infographic on the salary needed to buy a home across 50 U.S. cities.