On the Precipice [Chart]
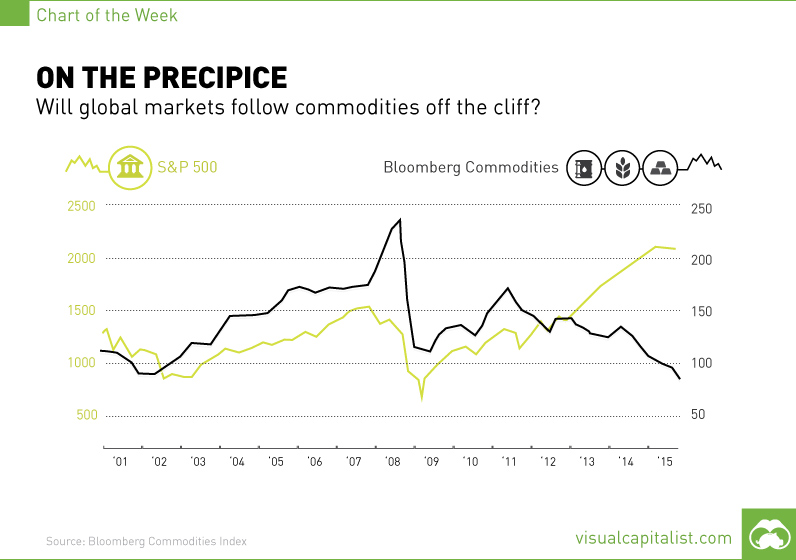
Will global markets follow commodities off the cliff?
The Chart of the Week is a weekly Visual Capitalist feature on Fridays. From 1970 to 2004, commodities moved the opposite direction of assets like equities and bonds. For example, it was during times such as the 1990s that cheap inputs like oil and metals helped to fuel growth in industries across the globe. When the oil price spiked, like in instances such as the Iranian Revolution and the subsequent Iran-Iraq War in 1980, the market reacted accordingly. In that particular case, inflation jumped to 11.3% in 1979 and 13.5% in 1980, a US recession was triggered, and many economic sectors were hit hard. However, as we see in today’s chart, from 2001-2012 commodities (as measured by the Bloomberg Commodities Index) have more or less kept in line with the S&P 500. This is historically unusual and many analysts expected it would not last. In 2012, commodities diverged in a big way. Gold and silver were the first to drop off. More recently, it was base metals and oil that fell off the cliff because of slowing growth in China and supply gluts. Today, the Bloomberg Commodity Index and the TSX Venture Composite Index are lower than they have ever been since their inception. The former is down -19.9% from the beginning of 2001. The Venture is down -40.1% since then. Today may be the end of this trend of divergence. US equities are at a precipice: fueled by low rates and quantitative easing for years, they have finally started to tumble from record highs. Yesterday, the Dow had its largest one-day drop since April 2014 as it slid 350 points. Even tech darlings were down as $49 billion in market capitalization was wiped out, with Apple, Google, Netflix, Facebook, and Twitter all getting crushed in trading yesterday. Market sentiment is decidedly worse than it has ever been in recent years with the tailwinds of Greece, Puerto Rico, China, and other problems. Making predictions are the dumbest possible idea, but they say that fortune favours the brave. So here are some bold predictions: Gold will at least hold its current value, if not see gains in the upcoming six month. US equities do not see sizable gains for awhile. The Fed does not hike rates in September (or if they do, it will be to a lack of fanfare from the markets). Industrial commodities like base metals will continue to drop off a little further as the overall market feels like it has lost momentum and supply gluts remain supreme. What do you think will happen in the short and medium term?
on Last year, stock and bond returns tumbled after the Federal Reserve hiked interest rates at the fastest speed in 40 years. It was the first time in decades that both asset classes posted negative annual investment returns in tandem. Over four decades, this has happened 2.4% of the time across any 12-month rolling period. To look at how various stock and bond asset allocations have performed over history—and their broader correlations—the above graphic charts their best, worst, and average returns, using data from Vanguard.
How Has Asset Allocation Impacted Returns?
Based on data between 1926 and 2019, the table below looks at the spectrum of market returns of different asset allocations:
We can see that a portfolio made entirely of stocks returned 10.3% on average, the highest across all asset allocations. Of course, this came with wider return variance, hitting an annual low of -43% and a high of 54%.
A traditional 60/40 portfolio—which has lost its luster in recent years as low interest rates have led to lower bond returns—saw an average historical return of 8.8%. As interest rates have climbed in recent years, this may widen its appeal once again as bond returns may rise.
Meanwhile, a 100% bond portfolio averaged 5.3% in annual returns over the period. Bonds typically serve as a hedge against portfolio losses thanks to their typically negative historical correlation to stocks.
A Closer Look at Historical Correlations
To understand how 2022 was an outlier in terms of asset correlations we can look at the graphic below:
The last time stocks and bonds moved together in a negative direction was in 1969. At the time, inflation was accelerating and the Fed was hiking interest rates to cool rising costs. In fact, historically, when inflation surges, stocks and bonds have often moved in similar directions. Underscoring this divergence is real interest rate volatility. When real interest rates are a driving force in the market, as we have seen in the last year, it hurts both stock and bond returns. This is because higher interest rates can reduce the future cash flows of these investments. Adding another layer is the level of risk appetite among investors. When the economic outlook is uncertain and interest rate volatility is high, investors are more likely to take risk off their portfolios and demand higher returns for taking on higher risk. This can push down equity and bond prices. On the other hand, if the economic outlook is positive, investors may be willing to take on more risk, in turn potentially boosting equity prices.
Current Investment Returns in Context
Today, financial markets are seeing sharp swings as the ripple effects of higher interest rates are sinking in. For investors, historical data provides insight on long-term asset allocation trends. Over the last century, cycles of high interest rates have come and gone. Both equity and bond investment returns have been resilient for investors who stay the course.