Chart: The Rate of Change in U.S. Energy Consumption
This chart shows the winners and losers in energy sources used
The Chart of the Week is a weekly Visual Capitalist feature on Fridays. Weeks ago, we published a flow chart that showed all U.S. energy consumption from 2015 in one giant diagram. This is a great tool for understanding a static picture of U.S. energy consumption – it breaks down the energy sources, as well as the details about where the energy ultimately flows. It also shows that a large amount of energy potential, about 61%, is inevitably “wasted” due to the laws of physics as well as inefficient processes. However, because it is a static view of one year, it ends up doing a poor job of encapsulating how the energy sector is shifting. This week’s chart shows the changing landscape for different energy sources in the United States.
Examining the Shift in U.S. Energy Consumption
As a starting point, based on the aforementioned diagram of energy usage, let’s look at the composition of the energy mix:
Oil: 36% Natural gas: 29% Coal: 16% Renewables: 10% Nuclear: 9%
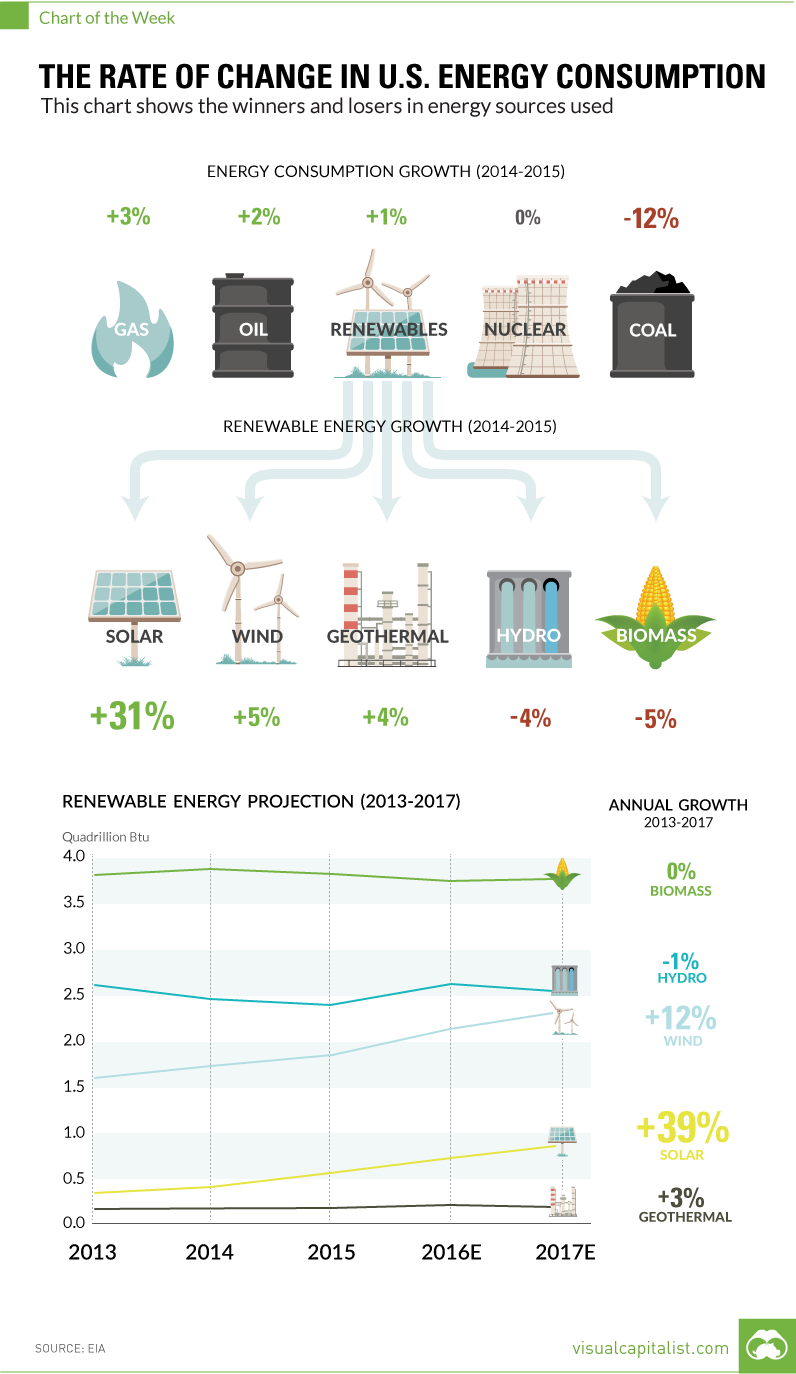
Now, let’s look at the rate of change of these broad categories between 2014 and 2015 according to the EIA:
Oil: +2% Natural gas: +3% Coal: -12% Renewables: +1% Nuclear: 0%
On a macro level, the first obvious note is that coal consumption dropped rapidly in 2015. This, along with other factors, is why many people are declaring that coal is dead. Another interesting observation is that renewables only increased by 1% in consumption. This seems strange, considering that there is such hype around things like the Tesla Gigafactory and the surging demand for lithium-ion batteries. Diving a bit deeper will provide an explanation for this.
Renewable Energy
There are five main components that make up U.S. renewable energy: solar, wind, hydro, geothermal, and biomass. The biggest sub-sector is biomass, which made up about 43% of all renewable usage in the United States in 2015. Hydro is also significant, as it is 27% of the renewable total. However, as you will see, consumption in biomass and hydro dropped between 2014 and 2015:
Biomass: -5% Hydro: -4% Wind: +5% Solar: +31% Geothermal: +4%
Even though the biomass and hydro consumption dropped, the future of renewables is in good hands. In particular, it has been the miraculous change in the price per watt of solar energy that has changed the landscape. Solar energy consumption, even though it is a relatively small number compared to other energy sources, increased by 31% in 2015. As a final point, here is the data and projections going out to 2017 for the main renewable sources, according to the EIA. Note that solar’s CAGR (compound annual growth rate) is 39% between 2013 and the projected 2017 number.
Renewable energy consumption (Quadrillion Btu, 2015)
on Last year, stock and bond returns tumbled after the Federal Reserve hiked interest rates at the fastest speed in 40 years. It was the first time in decades that both asset classes posted negative annual investment returns in tandem. Over four decades, this has happened 2.4% of the time across any 12-month rolling period. To look at how various stock and bond asset allocations have performed over history—and their broader correlations—the above graphic charts their best, worst, and average returns, using data from Vanguard.
How Has Asset Allocation Impacted Returns?
Based on data between 1926 and 2019, the table below looks at the spectrum of market returns of different asset allocations:
We can see that a portfolio made entirely of stocks returned 10.3% on average, the highest across all asset allocations. Of course, this came with wider return variance, hitting an annual low of -43% and a high of 54%.
A traditional 60/40 portfolio—which has lost its luster in recent years as low interest rates have led to lower bond returns—saw an average historical return of 8.8%. As interest rates have climbed in recent years, this may widen its appeal once again as bond returns may rise.
Meanwhile, a 100% bond portfolio averaged 5.3% in annual returns over the period. Bonds typically serve as a hedge against portfolio losses thanks to their typically negative historical correlation to stocks.
A Closer Look at Historical Correlations
To understand how 2022 was an outlier in terms of asset correlations we can look at the graphic below:
The last time stocks and bonds moved together in a negative direction was in 1969. At the time, inflation was accelerating and the Fed was hiking interest rates to cool rising costs. In fact, historically, when inflation surges, stocks and bonds have often moved in similar directions. Underscoring this divergence is real interest rate volatility. When real interest rates are a driving force in the market, as we have seen in the last year, it hurts both stock and bond returns. This is because higher interest rates can reduce the future cash flows of these investments. Adding another layer is the level of risk appetite among investors. When the economic outlook is uncertain and interest rate volatility is high, investors are more likely to take risk off their portfolios and demand higher returns for taking on higher risk. This can push down equity and bond prices. On the other hand, if the economic outlook is positive, investors may be willing to take on more risk, in turn potentially boosting equity prices.
Current Investment Returns in Context
Today, financial markets are seeing sharp swings as the ripple effects of higher interest rates are sinking in. For investors, historical data provides insight on long-term asset allocation trends. Over the last century, cycles of high interest rates have come and gone. Both equity and bond investment returns have been resilient for investors who stay the course.