Market Snapshot: September 2015
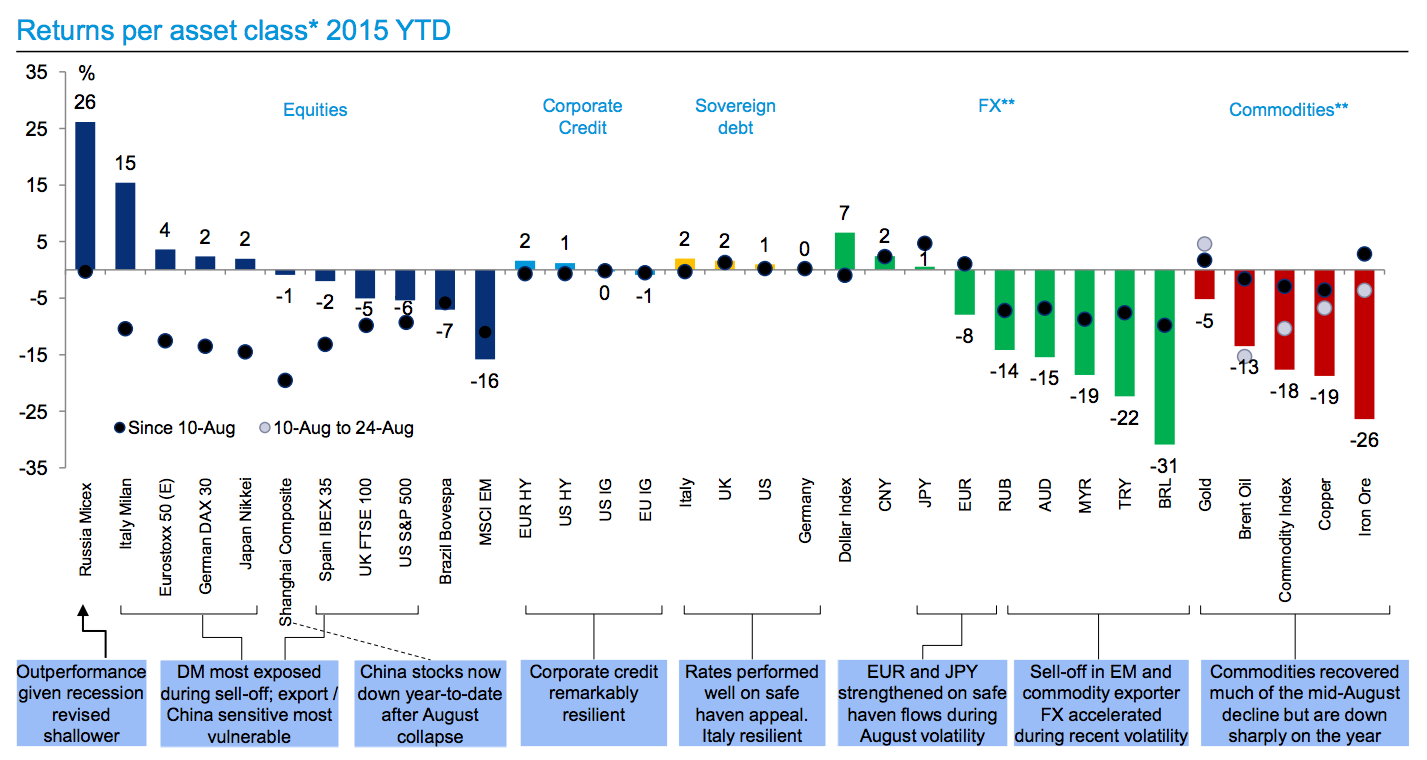
Deutsche Bank recently provided a graphical snapshot that covers the returns of a wide span of assets both YTD and since the mid-August meltdown. In addition, they added some market commentary on the situation investors find themselves in as they get back in gear for the autumn. First, let’s recap the spring and summer. Chinese markets started the year with gusto, but lost all of the gains during the summer as the bubble burst. Equity markets in the U.S. soon followed, with the Dow shedding almost 2,000 points in August before beginning a small bounce back. Commodities have all been crushed thoroughly YTD and especially in the last two weeks of August. Despite all of this, there is one stock market that has bucked these trends with outperformance. That market belongs to Russia, where equities are up 26% on the year and have remained relatively flat since all other markets melted down in mid-August. Russian stocks are not rising because the country’s economy is healthy – they are up because it is less worse than investors thought. The quick story on Russia: the country is in its worst recession since the Financial Crisis, and had its GDP shrink -4.6% up to Q2 of this year. The ruble has depreciated against the U.S. dollar by 16% YTD, and it also lost plenty of purchasing power last year as oil prices got hammered. Many spectators had expected the re-emergence of a currency crisis similar to 1998. Adding in possible geopolitical tail risks, publications started to recommend ways to play the Russian crash. Instead, it seems so far that Russia has been able to stabilize better than expected, and as a result stocks have rewarded investors that weren’t so pessimistic.
on Last year, stock and bond returns tumbled after the Federal Reserve hiked interest rates at the fastest speed in 40 years. It was the first time in decades that both asset classes posted negative annual investment returns in tandem. Over four decades, this has happened 2.4% of the time across any 12-month rolling period. To look at how various stock and bond asset allocations have performed over history—and their broader correlations—the above graphic charts their best, worst, and average returns, using data from Vanguard.
How Has Asset Allocation Impacted Returns?
Based on data between 1926 and 2019, the table below looks at the spectrum of market returns of different asset allocations:
We can see that a portfolio made entirely of stocks returned 10.3% on average, the highest across all asset allocations. Of course, this came with wider return variance, hitting an annual low of -43% and a high of 54%.
A traditional 60/40 portfolio—which has lost its luster in recent years as low interest rates have led to lower bond returns—saw an average historical return of 8.8%. As interest rates have climbed in recent years, this may widen its appeal once again as bond returns may rise.
Meanwhile, a 100% bond portfolio averaged 5.3% in annual returns over the period. Bonds typically serve as a hedge against portfolio losses thanks to their typically negative historical correlation to stocks.
A Closer Look at Historical Correlations
To understand how 2022 was an outlier in terms of asset correlations we can look at the graphic below:
The last time stocks and bonds moved together in a negative direction was in 1969. At the time, inflation was accelerating and the Fed was hiking interest rates to cool rising costs. In fact, historically, when inflation surges, stocks and bonds have often moved in similar directions. Underscoring this divergence is real interest rate volatility. When real interest rates are a driving force in the market, as we have seen in the last year, it hurts both stock and bond returns. This is because higher interest rates can reduce the future cash flows of these investments. Adding another layer is the level of risk appetite among investors. When the economic outlook is uncertain and interest rate volatility is high, investors are more likely to take risk off their portfolios and demand higher returns for taking on higher risk. This can push down equity and bond prices. On the other hand, if the economic outlook is positive, investors may be willing to take on more risk, in turn potentially boosting equity prices.
Current Investment Returns in Context
Today, financial markets are seeing sharp swings as the ripple effects of higher interest rates are sinking in. For investors, historical data provides insight on long-term asset allocation trends. Over the last century, cycles of high interest rates have come and gone. Both equity and bond investment returns have been resilient for investors who stay the course.