On one hand, they still make up a dominant piece of the current energy mix, and oil is still seen as a crucial resource for achieving geopolitical significance. It’s also no secret that fossil fuels are a driver for many economies around the world. But with governments and corporations counting carbon emissions and mounting concerns about climate change, reliance on these same fuels will not last forever. As attitudes and policies evolve, they will continue to see a reduced role going forward.
Visualizing Fossil Fuels by Country
So, which countries are pumping out the most hydrocarbons? Today’s cartograms come from 911Metallurgist, and the animated maps resize each country based on their share of global fossil fuel production. Below, you’ll see four cartograms that cover oil, gas, coal, and total fossil fuel production.
Crude Oil Production
The United States leads this category, producing about 18% of the world’s total oil:
Although the U.S. is the number one producer globally, it should be noted that the country doesn’t have the same quantity of oil reserves as other leading nations. Weirdly, Venezuela has the exact opposite problem. The country has the most oil reserves in the world, but currently only sits as its 12th biggest producer.
Natural Gas Production
In terms of gas, the U.S. leads again with a 20% share of global production. Russia is also a gas powerhouse, with a 17.3% share.
After the U.S. and Russia, it’s a fairly steep dropoff in terms of natural gas production. Countries like Iran, Canada, Qatar, and China are the next most significant players, but they each only produce 4-6% of the global total.
Coal Production
Coal use may be on the decline, but China still produces a whopping 45% of the world’s coal.
China’s current relationship with coal is an interesting one. Every year, coal has become less important in China’s energy mix – in 2011 it represented 70% of energy consumption, and by 2018 it had fell to 59%. Despite this meaningful progress, China’s economy has grown so fast, that coal use has essentially held steady in absolute terms. Meanwhile, the country’s production of coal has actually grown slightly over the same timeframe.
Total Fossil Fuel Production
Finally, here is the sum of all three above categories, converted to metric tonnes:
The United States produces 20% of all global fossil fuels, with Russia and Iran rounding out the top three. After that comes Canada, which produces just under 5% of all fossil fuels globally. on
#1: High Reliability
Nuclear power plants run 24/7 and are the most reliable source of sustainable energy. Nuclear electricity generation remains steady around the clock throughout the day, week, and year. Meanwhile, daily solar generation peaks in the afternoon when electricity demand is usually lower, and wind generation depends on wind speeds.As the use of variable solar and wind power increases globally, nuclear offers a stable and reliable backbone for a clean electricity grid.
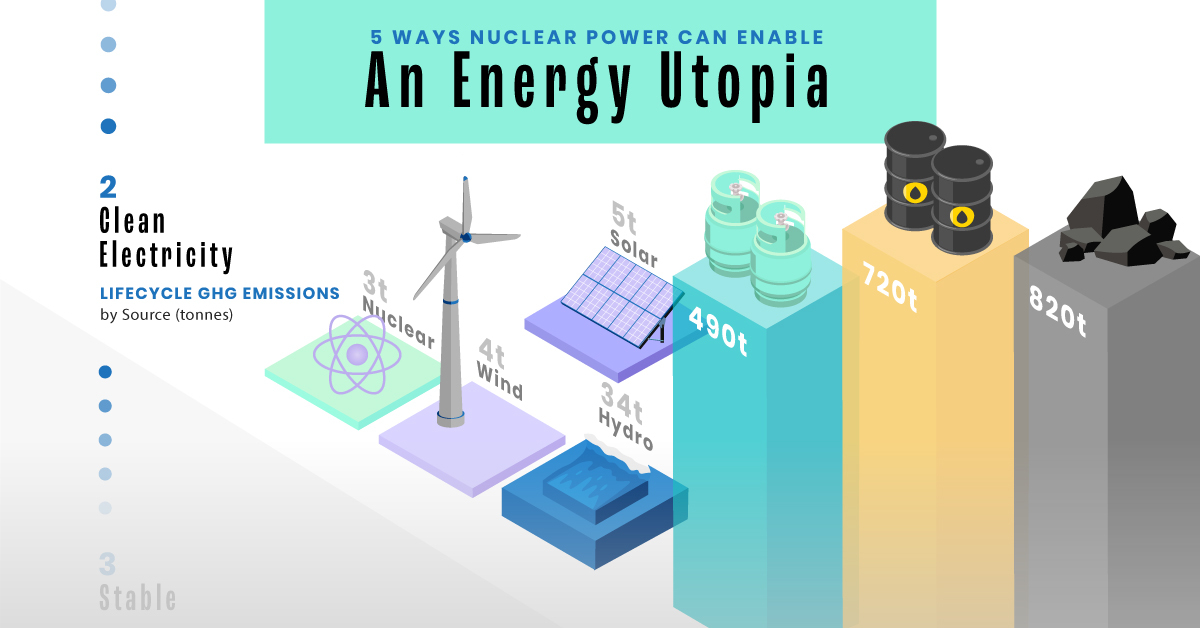
#2: Clean Electricity
Nuclear reactors use fission to generate electricity without any greenhouse gas (GHG) emissions.Consequently, nuclear power is the cleanest energy source on a lifecycle basis, measured in CO2-equivalent emissions per gigawatt-hour (GWh) of electricity produced by a power plant over its lifetime. The lifecycle emissions from a typical nuclear power plant are 273 times lower than coal and 163 times lower than natural gas. Furthermore, nuclear is relatively less resource-intensive, allowing for lower supply chain emissions than wind and solar plants.
#3: Stable Affordability
Although nuclear plants can be expensive to build, they are cost-competitive in the long run. Most nuclear plants have an initial lifetime of around 40 years, after which they can continue operating with approved lifetime extensions. Nuclear plants with lifetime extensions are the cheapest sources of electricity in the United States, and 88 of the country’s 92 reactors have received approvals for 20-year extensions. Additionally, according to the World Nuclear Association, nuclear plants are relatively less susceptible to fuel price volatility than natural gas plants, allowing for stable costs of electricity generation.
#4: Energy Efficiency
Nuclear’s high energy return on investment (EROI) exemplifies its exceptional efficiency. EROI measures how many units of energy are returned for every unit invested in building and running a power plant, over its lifetime. According to a 2018 study by Weissbach et al., nuclear’s EROI is 75 units, making it the most efficient energy source by some distance, with hydropower ranking second at 35 units.
#5: Sustainable Innovation
New, advanced reactor designs are bypassing many of the difficulties faced by traditional nuclear plants, making nuclear power more accessible.
Small Modular Reactors (SMRs) are much smaller than conventional reactors and are modular—meaning that their components can be transported and assembled in different locations. Microreactors are smaller than SMRs and are designed to provide electricity in remote and small market areas. They can also serve as backup power sources during emergencies.
These reactor designs offer several advantages, including lower initial capital costs, portability, and increased scalability.
A Nuclear-Powered Future
Nuclear power is making a remarkable comeback as countries work to achieve climate goals and ultimately, a state of energy utopia. Besides the 423 reactors in operation worldwide, another 56 reactors are under construction, and at least 69 more are planned for construction. Some nations, like Japan, have also reversed their attitudes toward nuclear power, embracing it as a clean and reliable energy source for the future. CanAlaska is a leading exploration company in the Athabasca Basin, the Earth’s richest uranium depository. Click here to learn more now. In part 3 of the Road to Energy Utopia series, we explore the unique properties of uranium, the fuel that powers nuclear reactors.


