After all, aside from a few smaller, intermittent spikes over the course of the current bull market, volatility has largely been in a long-term downtrend since the aftermath of the 2008 Financial Crisis. Whether there is more volatility lurking ahead this year or whether the markets continue to calm, it’s worth looking at the last century of market history to put these recent bouts of volatility into context.
Learning From the History of Markets
Today’s infographic comes to us from New York Life Investments and it goes back in time to show us that the volatility experienced in 2018 was neither exceptional or unusual. Here are five important lessons to learn from it all:
With volatility back on the table again, investors are re-learning what it’s like to cope with a sometimes tumultuous market. Higher volatility can be a source of uncertainty for even the most seasoned investors, but a look at historical data over the last century helps to ease these concerns.
5 Lessons About Volatility
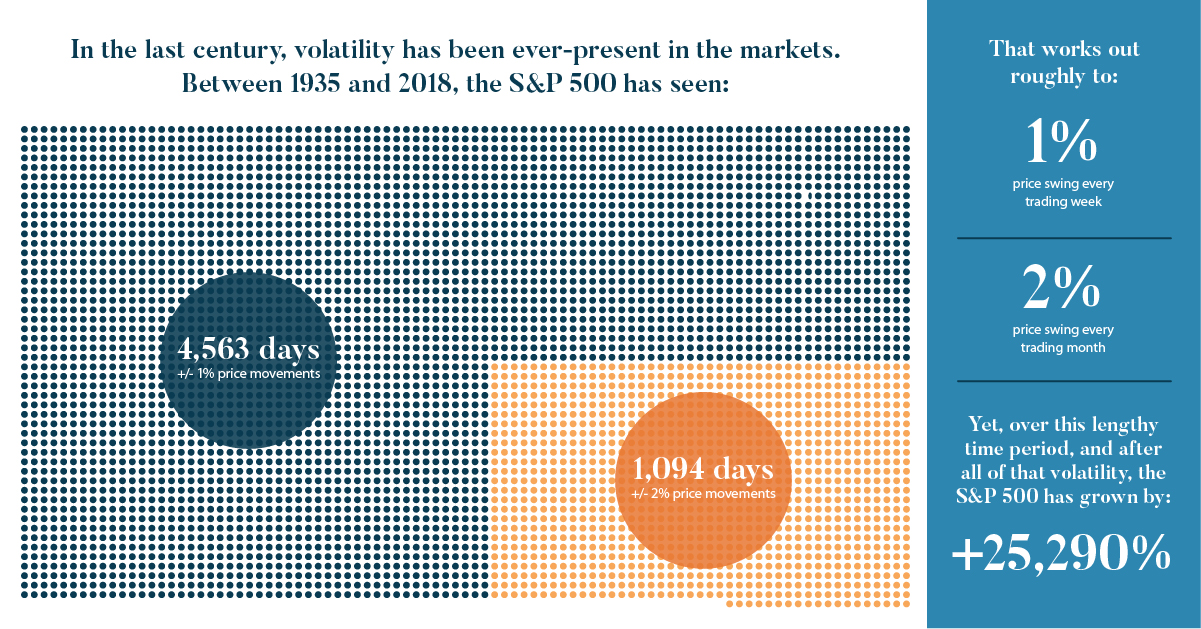
Here are five lessons about volatility that we can learn from the history of markets: Lesson #1: Volatility isn’t new Volatility isn’t a new phenomenon – and it’s actually as old as the stock market itself. In fact, if you look at historical swings in the Dow Jones Industrial Average, you’ll see that many of the biggest ones were more than 80 years ago. Lesson #2: Volatility is actually the status quo In the last century, volatility has been ever-present in the markets, and between 1935 and 2018 the S&P 500 has seen:
4,563 total days with +/- 1% price movements 1,094 total days with +/- 2% price movements
That works out roughly to a 1% price swing every trading week – and a 2% price swing every month. Yet, over this lengthy time period, and after all of that volatility, the S&P 500 has grown by 25,290%. Lesson #3: Any short-term volatility disappears with a long-term view Daily price swings can feel like a roller coaster. But if you take a step back and look at the big picture, this volatility is just a blip on the radar. For example, if you look at a chart of the S&P 500 from August 1990 to February of 1991, you’ll see that daily volatility was rampant. But zoom out to a 10-year chart, and these daily or weekly swings are barely noticeable. Lesson #4: Volatility can be easily weathered with a resilient portfolio Given that volatility has been around forever and that it’s extremely common, that makes it fairly unavoidable. Therefore, to weather periods of volatility, it is imperative to build a resilient portfolio by diversifying between different asset classes. Certain assets are better at weathering periods of volatility than others. Here are some traits to look for: (a) Low correlation with the market These assets can zig when others zag, making them a valuable hedge (Examples: Gold, alternative assets, municipal bonds) (b) Generates cash flow When times are uncertain, the market puts extra value on assets that are generating real cash flow (Examples: Stocks that pay dividends, or bonds that pay interest) (c) Defensive or non-cyclical During uncertain times, there are still companies with stocks that will thrive. They are usually bigger companies with conservative balance sheets and durable competitive advantages. (Examples: Quality stocks in healthcare, consumer staples, telecoms, REITs, and utilities sectors) Lesson #5: Volatility reminds us that there is no reward without risk Investing in stocks comes with risks, but it also comes with the best returns over time: If stocks offer the best long run gains – and volatility is an unavoidable aspect of investing in stocks – then we must learn to accept volatility for what it is. Even better, we must learn to build resilient portfolios that can weather any storm, while minimizing these effects.
on These are in the form of Treasury securities, some of the most liquid assets worldwide. Central banks use them for foreign exchange reserves and private investors flock to them during flights to safety thanks to their perceived low default risk. Beyond these reasons, foreign investors may buy Treasuries as a store of value. They are often used as collateral during certain international trade transactions, or countries can use them to help manage exchange rate policy. For example, countries may buy Treasuries to protect their currency’s exchange rate from speculation. In the above graphic, we show the foreign holders of the U.S. national debt using data from the U.S. Department of the Treasury.
Top Foreign Holders of U.S. Debt
With $1.1 trillion in Treasury holdings, Japan is the largest foreign holder of U.S. debt. Japan surpassed China as the top holder in 2019 as China shed over $250 billion, or 30% of its holdings in four years. This bond offloading by China is the one way the country can manage the yuan’s exchange rate. This is because if it sells dollars, it can buy the yuan when the currency falls. At the same time, China doesn’t solely use the dollar to manage its currency—it now uses a basket of currencies. Here are the countries that hold the most U.S. debt: As the above table shows, the United Kingdom is the third highest holder, at over $655 billion in Treasuries. Across Europe, 13 countries are notable holders of these securities, the highest in any region, followed by Asia-Pacific at 11 different holders. A handful of small nations own a surprising amount of U.S. debt. With a population of 70,000, the Cayman Islands own a towering amount of Treasury bonds to the tune of $284 billion. There are more hedge funds domiciled in the Cayman Islands per capita than any other nation worldwide. In fact, the four smallest nations in the visualization above—Cayman Islands, Bermuda, Bahamas, and Luxembourg—have a combined population of just 1.2 million people, but own a staggering $741 billion in Treasuries.
Interest Rates and Treasury Market Dynamics
Over 2022, foreign demand for Treasuries sank 6% as higher interest rates and a strong U.S. dollar made owning these bonds less profitable. This is because rising interest rates on U.S. debt makes the present value of their future income payments lower. Meanwhile, their prices also fall. As the chart below shows, this drop in demand is a sharp reversal from 2018-2020, when demand jumped as interest rates hovered at historic lows. A similar trend took place in the decade after the 2008-09 financial crisis when U.S. debt holdings effectively tripled from $2 to $6 trillion.
Driving this trend was China’s rapid purchase of Treasuries, which ballooned from $100 billion in 2002 to a peak of $1.3 trillion in 2013. As the country’s exports and output expanded, it sold yuan and bought dollars to help alleviate exchange rate pressure on its currency. Fast-forward to today, and global interest-rate uncertainty—which in turn can impact national currency valuations and therefore demand for Treasuries—continues to be a factor impacting the future direction of foreign U.S. debt holdings.